Stock Market Predictions: S&P 500 Price Action 9-25-23
Transcript
Hey, everybody.
It’s Pete. Welcome to Stock Trading Pro. More importantly, welcome to Stocks for Breakfast where we kick off the entire week and I’m going to do something today that I never do. We’re going to make a prediction today about price action.
And I know that kinda sounds like out there and who forecast? Who predicts? Right? I’m very big on just reading the order flow and reading the tape, and I don’t like to do that.
But the way that the market is setting up right now, it’s almost too obvious for the way that price action is likely going to end up unfolding throughout the rest of September and probably into the 1st week or 2 of October.
The bears are probably going to like what we’re going to talk about today, but we do our set rotation as we do every Monday. And as a matter of fact, we do every day. But we’re going to break down sector rotation.
We have a couple of pockets of opportunity that are bullish hanging in there showing relative shrink while the market kind of demolished last week from the F1C. There’s also a very big news story that we’re going to talk about today.
Something that has been going on kind of behind the scenes going to affect streaming services. We’re also going to get a little bit into AI, which obviously has been the conversation Dujour for 2023.
And one big company which broke out into a big way early last week, 3 monster days of big green candles with heavy volume pulled back 15%, in the blink of an eye, and now it’s setting up another buying opportunity.
So we actually have a ton of stuff to talk about today. I love being here with you on Monday.
We set up the entire week. I love the comments. By the way, once these calls are going on and whether or not you’re on it live or whether you watch the replay, absolutely leave a comment below.
If we talk about anything today that, you want a little more information about it or you just didn’t understand that we how we covered it. I love the interaction.
So make sure that you leave a comment below. And look, if we do a good job, if we provide a lot of value, do me a favor. Hit that thumbs button and, make sure you subscribe because you’ll be getting a lot more updates.
We actually have a bunch of new shows coming out here on the channel as well. So We really want to get into it. Let me make sure I say hello to LJ.
Good morning, Tim. How are you? Great to see you here today. Oscar. How are you, my friend? Alright. Okay. So first, we’re going to start out with the prediction. The big prediction that we’re looking at in the S&P 500.
I want you to write down this number. One of the biggest things that we do in our community and something that I’m very big on is we kinda started out with predicting today.
But when you understand how to read order flow and understand tape reading, there’s really no predicting that needs to happen. Each stock has what it normally does. Now that’s just the natural function of the market.
That’s just the natural buying pressure back and forth. Now what is interesting is that there are different types of moves for your stock based on whether or not you’re in a bullish mark it or a bearish mark.
And I’m going to explain what I’m going to actually show you on the charts that we’re going to use the S&P 500, as an example for that.
So just before we get started, I got to make sure I put this up on the screen. So for everything that we’re about to discuss, this is all obviously educational. Right? It’s to you to make the final decision.
It’s been my mission to help you make better decisions. Right? So we’re going to first start out with a statistic that I want to bring up to, and I’ll actually kinda pop down into the side of the screen over here.
We’re going to use the S&P 500. And what’s really important is we’re going to make a distinction between these moves to the downside versus moves to the upside. And you could probably see it a little bit cleaner probably right here.
This is really a good explanation of it right here. And the tone of what price action does in a bullish move for the S&P 500, specifically the Spy ETF and what price action happens in a bearish move in the S&P 500.
Now typically, let me let me actually just draw this out for you. I want to I want to really put this in here in context.

You could essentially see here that we are looking at basically a $25 move to the upside in a bullish environment. And roughly we kinda go to the other side during this little pause here, we’re looking at roughly 8 to $10.
Right? So here’s what I want to get across. When you understand order flow and tape reading, when you have a really good framework for what the market, the stock market’s supposed to look like, it becomes a lot easier to say.
I know exactly what I’m looking for. So it’s easier for me to tell. Is it there? Or is it not there? So now this is the stuff that I want you to write down.
In the direction of the obvious order flow, So in other words, we’re either in a bullish environment or a bearish environment. So if you don’t know what that means, bullish means going up, bearish means going down.
So in a bullish market, or I should say in a trending S&P 500, both to the upside or to the downside, the moves in that direction are typically around $30.
So you want to make sure you write that down. So bullish move to the upside or a bearish move to the downside in the S&P 500, that price action is typically $30.
Now last week, we had a little bit of an, I don’t know if I want to say an overreaction to the FOMC, but we certainly had a stronger reaction than I think a lot of people expected simply because Jerome Powell said exactly what everybody thought he was going to say, but we had those 2 giant days to the downside.
How does that influence what we’re looking today. It’s not really a prediction. That part is not a prediction, but what we’re going to do is is actually map out exact what we expect to happen over the next 3 weeks to the next month.
Now that might sound like predicting, but it’s really not because price action, as I just said, is predictable. So when you have a road map for the way price action’s supposed to look, that is pretty easy.
And I’m going to show you exactly what I mean. So if we talk about the S&P 500 and when it moves in the direction of that particular order flow, We’re roughly looking at $30 moves.
Same thing on the downside. So if we kinda go over here to the downside, you can see that we’re roughly talking about a $30 move to the downside.
Right? And then if we kinda hop on over here and go to the next move, you can see that we’re roughly talking about a $30 move.
Now That’s kind of exciting because there’s 2 things. Number 1, for profit taking, that’s important to know when you’re pushing up or pushing into a level where it’s likely to find profit taking, you should know 1 of 2 things.
Number 1, is that the spot where you want to move up your trailing stop loss protect your gains because you know that’s where it would normally reverse, but here’s the one that’s even more importantly.
If you have a stock I’m just going to use round numbers.
If you have a stock that normally moves $10 and you get your entry set up and wherever that entry set up happens, maybe a rally pullback you still have, let’s say, $9 out of 10 based on your entry price for that particular setup.
There’s plenty of room to go based on what the stock normally does. So in that case, assuming you have an edge, you’re good to go on that idea because there’s sufficient profit potential.
And because of your edge, it’s likely to move in your direction. So you have good likelihood and you have good profit potential.
Right? Let’s take the next trade. If we go to the next trade where you put the trade on and it’s likely to continue going, but It’s already moved 8 out of $10 of what it normally moves.
Now we call that the average true move. Right? I consider the average true move and optimal entry, something really unique because, you know, everybody knows overbought and oversold indicators.
Right? But those don’t really give you clues on what the actual action is that you’re supposed to take.
So when we talk about optimal entry, we’re essentially saying you’re looking out of stock at the optimal moment when there is sufficient and likely reward potential, profit, based on that particular moment.
But let’s go back to what we’re talking about both in the S&P 500 and looking to enter new ideas.
The second part of that and the second really big lesson is that when you understand what a stock normally does, which we call the average true move, then it becomes very easy to know, are you buying too late?
And that’s really a big thing because we talk about And I have been talking about it for roughly 30 years now.
Yeah. About that. Is once you understand the right entry, you then stop yourself from buying too late, which means that you are now keeping that money in your pocket as opposed to, again, raise your hand.
And you say, every time I buy a stock, it goes up for a day and then crashes on me. I get stopped out, and then it does exactly what I thought it was going to do.
That’s a timing issue. And the way to fix your timing in a heartbeat is to understand what it normally does. Now what does that have to do with the market right now?
What does that have to do with predicting? So if we know that the market normally moves the S&P 500 on the downside normally moves 30 points. That should tell us now what did it just recently do and where is it in the big picture?
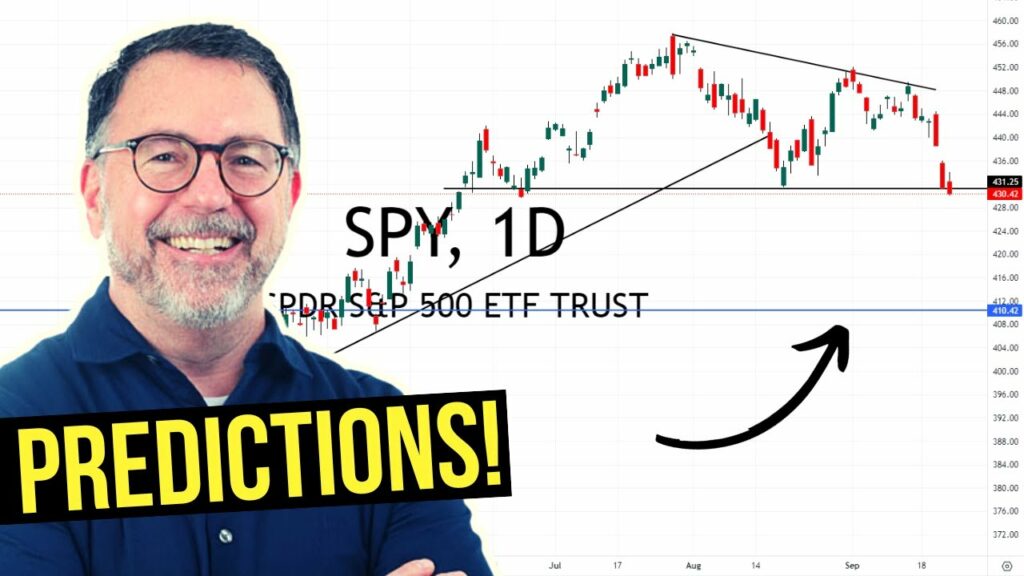
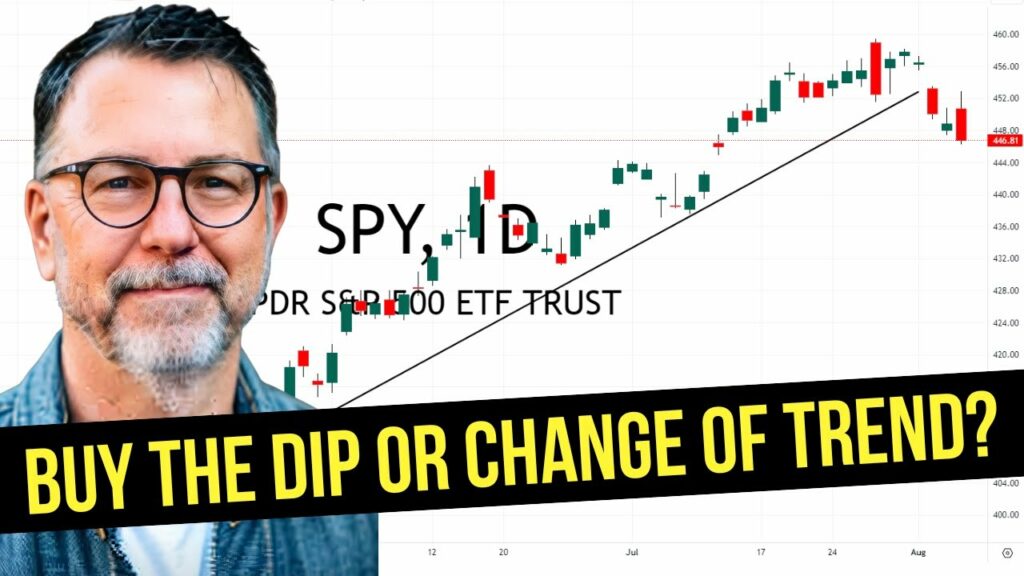
So the S&P 500 reacted pretty strongly over here when Jerome Powell, which let me just kinda zoom this out. So right over here is basically where we’re still kinda neutral.
Jerome Powell came out and we had this big aggressive move to the downside. Now what’s interesting about that and where that move started, we’re roughly looking at 450 down to roughly 4:30.
Right? So that’s only 20 points out of what it normally does. But we also have to factor in a little bit more that the last three times price hit this level. Buyer stepped up and defended that level.

That’s really important. Right? So we need to understand what normally happens, what happened at that last time. And, you know, I actually just want to come back here a second. A lot of people get confused on support or resistance levels.
And you probably heard the term major support, minor support. Right? Let’s first define what support and resistance levels mean when you’re using technical analysis. It’s nothing more Then where is the last significant place?
Buyers or sellers stepped up and did something. Oh, you might take that a little bit further. We call that holding the bid or holding the offer. Right? The push down and buyers stepped up and did something.
They held the bid. They got in there. Advertised to buy stock held it and it stopped going down. So we kinda tie that into the S&P 500, the spy ETF, the last three times now, we got down to this 4:30 level.
Buyers came in and defended it. We also have a very aggressive move to the downside based on what happened last week with the FOMC announcement and Jerome Powell.
Right? So raise your hand now. If you understand, excuse me, the classic technical patterns like head and shoulders top, head and shoulders, bottom, all those kinds of things, and also understand short covering.
So I think it’s a very common thought process right now that the classic old head and shoulders tops and those kinds of things, they don’t necessarily work right as soon as first time they get there because everybody in their grandmother’s looking at it.
Everybody in their grandmother has the same exact price and orders are right at level. Now, I’m not a conspiracy theorist or anything like that.
It’s just more a function of the market. You know, there’s mister market and all of us looking at it the same way. It seems to be over the last, I don’t know, decade, maybe or so.
Head and shoulders patterns still form, but when it’s super obvious, we tend to not get followed through on the first moves. And now we’re kinda getting into the predicting and paying attention to price action and whatnot.
So when you combine that bigger picture, head and shoulders top, you combine the fact that we are at a support level for the last three times and buyers came in and defended this level.
And we have the overreaction from the market on Jerome Powell. We’re going to talk about that in a second.
You have a recipe where the market is most likely going to punch down today, back up a couple of bit, a little bit, maybe for a day or 2. Hit that level that is a gap fill, which I’m going to show you in a second.
GAAP fills are very important and then likely have whatever the next move is going to be. So I want to put that in English. Right? I want to explain it to everybody. So everybody, it’s actionable.
That’s one of the most important things. Right? We’re at a really obvious support level in the market right now. Right? We had this massive overreaction, and I’m going to talk about why in just one second, and we’re sitting here.
So right now, the buyers are going to be thinking to themselves over the weekend. Was that news bad enough that we just let it go through this level or was it an overreaction?
And is this an opportunity to buy. So we have 2 different things going on, and we have this level right here. So here’s what I’m talking about. What I’m actually looking for is the market will most likely open lower today.
Buyers will most likely come in and defend that level and maybe even push it up for a day or 2. And we filled that gap, which is right around 4:38. Maybe right around 4:40.
If that happens and it happens on lighter volume, Then that will technically be a push down, a pause, and then most likely lead to another push lower, but not on the first push. Now, here’s the thing I want to get across to everybody.
And this is really where trading, becomes kind of fun. When you’re engaged in the stock market and you have the guts kind of put yourself out there and say, here’s what I expect to have happen next. That’s your argument.
That is the way that you look at the market. That’s the way that you put price action together based on what likely is happening next, what has happened in the past, and the way that the market’s setting up right now.
Like, that’s kind of the roadmap. Right? That’s how I’m looking at the market right now.
That’s what I’m expecting to happen. And the only reason we choose to put money out into the market is because we have a pretty good chance or a pretty good idea of what is likely to happen next.
Now does that mean it is definitely going to happen? No. Of course not. But if that’s the way I’m looking at it because of her my my years of experience, that’s what’s telling me is probably going to happen.
But here’s the thing that a lot of people mess up, and I want to talk about Disney for a second from last week. Or maybe 2 weeks ago. Okay? And I’ll get into that in just one second. Great traders build arguments.
And if you aspire to get to the point where maybe you want to retire comfortably and have the stock market pay you. Right? Or maybe you want to retire early and repay your pay via paycheck with the stock market.
You need to understand that the market and and speculating with the market is all based on what is probably going to happen next and what we are definitely going to do.
Now the part that a lot of smart people mess up is maybe they have an edge, but they get so in love with that strategy when what they expected to happen does not happen.
They lose all sense of reality, start trading emotionally, and they say they’re right and the market’s wrong.
And that is an expensive way to think. So what I just mapped out for you is would I teach everybody in my community and actually Tim here too. Tim, good morning.
How are you, pal? And Tim could back me up on this. Everything we talk about in the community is what is likely to happen What is the road map that tells us what’s likely to happen, which in our universe is order flow and tape reading?
So we have a perfect roadmap of that’s what it’s supposed to look like. Is it there? Great. Let’s go get it. If it’s not there, how far away from perfect is it? And then that means we’re going to adjust up or down our position size.
Right? So that’s I just did it on video. Right? We’re talking about what I expect to have happened this week. If it happens, I will trade aggressively get in there with position size exactly the way I just mapped it out.
If what I just mapped out does not unfold perfectly, that’s fine too because we have to remember When we take risk, when we choose to put a trade on, we’re doing it because of a probability of what’s likely to happen.
Now here’s the part that Everybody misses.
Well, maybe a few smart people don’t. Probability means most of the time. And this is the part that I want to get across. Right? When we are choosing to accept risk, we’re choosing to put our hard earned money in the way.
We are taking a risk, accepting risk because of what is likely to happen. The part that everybody misses or forgets or or throws out the window is probability means most of the time, not all of the time.
So if you come and trade with me, I’m going to drill this into you every single day. Trading is about probabilities, managing the downside, and then understanding how and when to hold your winning trades longer.
We call it that’s the profit maximizer in our universe. That’s how we it’s a whole structured system of making the most on your winning trade.
So actually just one winning trade per month could make your entire month. And a lot of those other ideas kinda wash each other out, which is why win loss percentage doesn’t matter. So here’s the thing.
I put it out on video. We just talked about what’s likely to happen this week. So we’re just going to drill that down even a little bit more. Okay? So if we end up pausing and doing what we talked about and filling this gap over here.
Right? So push down pause somewhere in this area filling this gap on the overreaction that sets up a new trade with the average true move in the S&P 500, which will be roughly 30 points.
Okay? So 30 points from 4. 40 brings us down to 410, which just perfectly coincides with the last place that the market started to rally.

That’s not predicting. That is simply saying, what does this stock normally do in the direction of the current bias, the current buying or selling pressure.
So that’s how I’m looking at the market this week. Now I know a lot of people don’t want the market to go down. I don’t want the market to go down, but I live in the reality of that’s what the price action is right now.
That’s the first part of the equation. The second part is why did the market overreact so much last week? Drove Powell came out and made a statement talking about how long they were going to keep interest rates higher.
I think the market was fully expecting that they were going to say at some point in the future, we are going to start reducing interest rates.
Not only did they not say what was expected. So remember, expectation is going to lead to a reaction. Right? That’s what I expect to have happened.
He did not say what they expected to have, what everybody was hoping to hear, which would have been another bullish move. He said the opposite, and that’s why we got that vicious move to the downside.
So you can kinda tie this into the way that we read earnings reports, which is the first number, which is what did they do from an earnings per share perspective and from a revenue perspective.
So that’s what was expected. That’s the initial move when earnings comes out.
Then they have the guidance after that, which is what are they expecting to have happened over the next quarter? Best case scenario in the next year. So when you watch an earnings report, there’s always 2 reactions.
There’s the what was expected and then what is expected going forward. That’s exactly what happens when an FOMC announcement happens is there’s the number, whether or not they’re raising, lowering, or doing nothing with interest rates.
And then there’s the meeting a half hour later where a drone pal’s language gets dissected 55 ways from Sunday, and they talk about what’s going forward.
And it was the going forward reaction because if you actually were watching the market that day, it actually open lower rallied all the way back up to where it started.
And then he started speaking at 2:30 and that’s where we kinda hit the skids. Right? So that’s the way the market is.
Now you have a choice. You have a choice to say, I want the market to go up, but right now, it’s not. Now that’s the that’s the fact. Right? The question is, how are you managing risk during that environment?
How are you managing your position size during that environment. So risk making sure that if you get stopped out, be okay with it. It’s one of those ideas that just didn’t work out. Even if it was a good idea, you just kick it out.
Get back into cash and the smart move is to then look for another idea. Assuming you hit the level that you believe was your stop loss. The second part the second part is understanding what is the right position size for new trades.
So if you want to be a buyer while the market’s going down, that means we have to move up into different opportunities, which means now we need to be sector specific or stock specific.
And most of what I’m looking at right now are stocks that are showing relative strength to the market going down.
So what that essentially means is when the market’s going down, These stocks are either going up or not going down. So they’re kinda going sideways, which we would call holding the bid.
So what I’m going to show you now is a of ideas that I have going into this week with relative strength. So again, let’s go back to what I talked about at the beginning of today’s call.
Which is none of these ideas are predictions. A lot of people make the mistake that, and I have this quote that I like to use that The idea that got us to the trade is going to be a different strategy that will help us make money.
So there’s all of the ideas getting us there which are setting up order flow and reading the tape. And then the second half, the back half of the trade is the optimal entry and the profit maximizer, which is when do we get in?
At the right time. And how do we hold those winning trades longer? So despite the fact that the market’s going down, I have a bunch of ideas that I want to share with you right now based on relative strength at this moment.
Okay? Now I do want to point out one trade from about a week and a half ago, maybe 2 weeks ago, we were looking at Disney. Disney had a monster support level that actually broke down and it was a profitable trade for us.
But our strategy says we have different positions where if it’s moving in our favor doing exactly what we want, we have a planned place to add more shares and then trail that trade as it moves in our favor.
And this happened to be a short sale opportunity to the downside.
So you could either short the stock or by puts, betting that it’s going to go down. Now here’s the interesting thing, and this is where we put our money where our mouth is. We had a short sale in Disney. It broke down.
Somebody on YouTube had asked me 2 weeks after the fact, how did that trade work out for me? Now this trade was profitable to start out and then it rallied back up to our entry price, which means that we took a flat on the position.
So the way that most of the trades work out that we do that we put the trade on And we have a second place where we add more shares if it moves a certain amount in our favor.
Disney did that. After we entered the trade, it actually caught buying and then rallied back up to our original entry price.
So what was a small profitable trade turned into a small losing trade. Now I want to walk you through first the trade and then the mindset. Right?
So if we take a look at Disney, because this is actually playing out into a much bigger play and why the stocks actually up a little bit this morning. So if you take a look over here, that’s actually the price that we were looking at.
Right? We were looking at as big support level. It really meant a lot. We kept talking about 85, 85 to 85, and you can go back to the video and watch it.

And that’s exactly what happened. And there’s actually 2 trades. I want to walk you through this because I want to make sure that you understand you’re not going crazy. Okay? So, actually, this push down right here is set up perfectly.
Could not have done any more than we could have expected. Right? Then it pulled back a little bit, pulled back a little bit, moved down a little bit, and that’s actually where our system said, let’s get more shares, right?
If you just look at that picture and you’re looking for it to go down, It’s doing exactly what we would want it to. We don’t know what’s going to happen next.
We have all that information up to the moment of placing the trade. So in that particular moment, it broke this big support level. It pushed down in our level. It paused. And then another bearish move to the downside.
Great. Let’s put some more shares on. Now here’s the part where a lot of traders just really, need to understand the mental aspect of trading and really kinda just think things through without getting emotional about it.
That was a really good idea that did exactly what we wanted to. And at that moment, you put on more shares and you’re like, wow, this is fantastic. Right? But you still have to be open to the fact that the market can do anything.
Now this is really where we really want the lesson that we want to get across. So as Disney starts to move in our favor, We start to catch some buying pressure, and you can see it came all the way back to our entry price.

Now it’s very easy to say after the fact, you should have. You could have. You would have. Right? You can’t do that. You’ll beat yourself up and you will second guess yourself all the time.
The right play for me in that situation was it was doing everything I wanted it to do. And what should have happened is it should have continued to push down, but it didn’t.
I am perfectly okay because it’s more important for me to do what I’m supposed to do all of the time But place orders based on what is likely to happen.
And that’s the part that you’re probably struggling with right now. If you can’t get a grip on the market is that you’re trying to be right.
Instead of understanding that it’s just a question of setting up good ideas, letting them unfold, and following your rules. Is the consistency in following our rules assuming you have them where the consistency in our profits come from.
Not from being able to predict what’s going to happen next. That’s very, very important. So I forgot who it was, but somebody had asked me about that trade.
And I said, I took a flat. It went down, moved to my favorite, came back, and I get out at the same place. So here’s the thing. I took a flat, which means that my original entry got back to the same price and I got out at that price.
The second piece was a small loss from where I added it up to where I got in the first piece. So the first piece I broke even on, the second piece I took a small loss on. Now let’s think this through. This is really important.
If you told me right now for the rest of my trading career on winning trades that start moving in my favor, I am always going to have a small loss, or if they continue in the direction I thought, a monster winner because I added as it moved in my favor.
I would take that the rest of my life. And I hope you really understand that. Put the trade on, moves in your favor, add a little bit more.
And at that point, you have a small loss or a big win because you have more shares and you understand, and hopefully you have something like we do, a profit maximize, which tells you how to follow that trade in that direction.
The problem that a lot of traders have and maybe you’re one of them is you get all emotionally bent out of shape out of a trade that started out in your favor, came back, and now he’s kind of in the phantom zone, and you’re not sure what to do.
Have rules. Rules will keep you in the game long enough to start picking better stocks.
And the reason I mean that is because picking better stocks you will find a lot of those ideas when you’re better stock picker is they won’t come back and shake you out, and you’ll end up holding on to some of those ideas with a lot less stress.
And that’s really just a question of understanding what it means to read order flow and to read the tape.
Better stock selection translates into easier trades. We covered a lot of stuff today. Probably going to want to watch this video one more time going all the way back to the beginning.
So we’re going to stick with Disney here for a second because there’s actually a news story that we’ve been talking about, that’s kind of important, which is the Hollywood writers strike.
Now we know that this is, very much affecting everything. Obviously, probably 2 of the biggest ones are Disney and Netflix.
And if you can see what Disney has done recently. Let me zoom this out a little bit here. It’s still kinda stuck in this box, but you could see it’s up a little bit this morning and Netflix.
Now that said tentative rider strike that didn’t say it’s over. However, if and when this thing starts to resolve itself, We’re likely going to see a violent move back in the other direction, and then we’re going to be waiting for the pause.
It’s that pause that will help us reset the risk on this new catalyst for a new idea in that direction.
So what does that mean? That means that there’s 2 things. There’s your game plan and your tracking journal. Your game plan or stocks that you’re looking at today and this week. Those are actionable right now at this moment.
What we’re talking about here in this for the streaming services is that now those are going into our tracking journal and we are looking for the next headline that says, yes, indeed, the strike is done.
We’re going back to work. And we’re probably going to see an overreaction in the other direction based on that good news.
So because it’s in your tracking journal, you now know to be watching for that headline for a potential trading opportunity if and when that right of strike happens.
And now you’re already going to know which stocks to take a look at. And that’s kinda cool because now you’re just being prepared looking for a certain headline instead of looking for everything.
Okay? So if we continue to take a look at the way the market been trading Amazon, which actually was looking fantastic about a week and a half ago, and just got absolutely clobbered.
I think this is a 15% pullback or something big like that. Maybe a little bit less. Just over 12%. Right? So Amazon now coming out with the buzzword of the year.
Right? AI. We’re going to get into AI. We’re going to start blah blah blah blah. Right? So this is a potential catalyst to start paying attention to Amazon very much the same way that we were watching in video this year.
NVIDIA story on AI played out in a big way. SMCI Story and AI played out in a really big way. This is a triple of the stock.
Now do I think Amazon’s going to triple? No. However, we do have a stock that doubled this year, and this is getting into. And, actually, that’s very awesome here. We’re going to talk about that. Dell. Dell has doubled since March.

Doubled 36 to 72. We’re actually going to break this down in a second. We’re actually going to break that down. So what’s going through your mind right now when you see a relatively inexpensive stock go from 36 to 72 over the last 5 months.
In a pretty straightforward easy to grind higher manner, If you did not see that, which is a big part of what I do in my community, we have to ask ourselves why?
Do we not have the structure that tells us when something’s in order load? Do we not have the structure and tell something that has changed from downtrend to uptrend? And I talk about that a lot here on this channel as well.
Or are we simply not spending that extra 10 minutes every night saying, how do I identify which stocks are moving and how do I know that they’re still valid? If we go back to this chart of Dell, that’s a pretty solid move.
1 earnings report, 2 earnings reports, 3 earnings reports in a row of bullish pressure in that direction. So now I’m not saying this to make, obviously, not saying it to make anybody feel big.
What I want to do is challenge you a little This is a stock in the last 5 to 6 months that’s had a slow grinding move higher and doubled So if everybody out there saying there’s nothing to do, I can’t find anything.
You’re wrong. There’s no other way to put it. Don’t want to sound like Jim Kramer and say there’s a bull market always.
However, when you put in that little bit extra time, and I’m going to show you how I do that in just a second, You start to unpack pockets of opportunity that become a little bit more obvious.
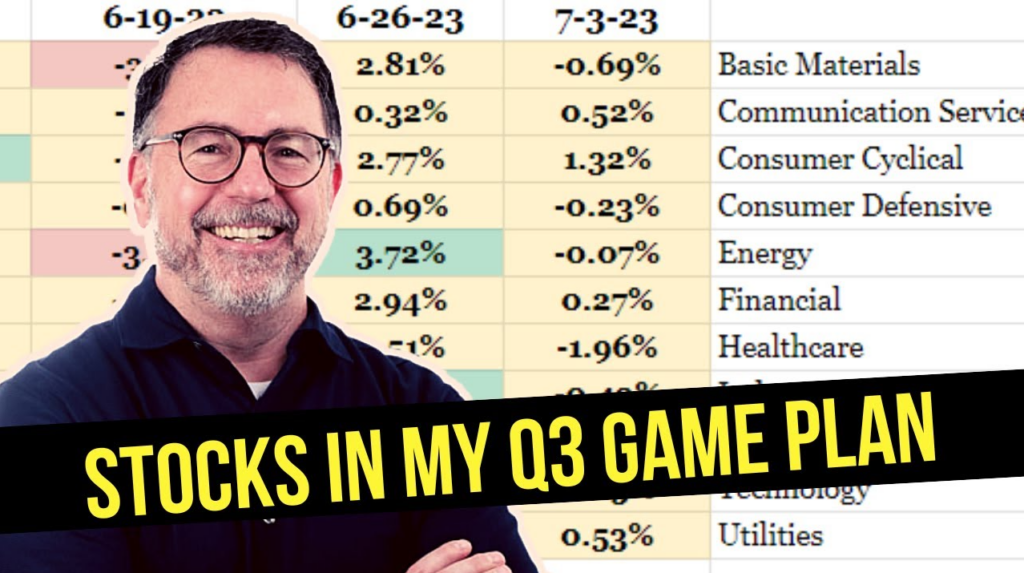
So when we’re doing that kind of stuff, and we start to unpack it. You have to start out with sector rotation and what the market has been doing and how you plan to look at that.
Right? Then you break it down by day and you start to notice pockets of opportunity. Then you start to break that down a little bit deeper and you start to pay attention to where is buying pressure despite the market going down.

So these are the first places you would consider. And actually, David’s talking about our call on Saturday. We actually spent a lot of time on Saturday talking about an understanding short selling.
So if you understand short selling, you would actually go over to sectors and you would start to find where the dominant number of stocks are showing bearish order flow.
So right now, you can see that the majority of the bearish stocks would be in consumer cyclical.
Then you start to work your way over a little bit deeper and you start to pay attention to which stocks are leading which stocks are lagging. And we work our way through that.

Healthcare has sprung up to the top of the list. We continue to work our way through those metrics. Then we work our way through the metrics and we take a look and see what kind of environment have we had for September.
And you could see mostly bearish. So if you understand short selling, then you understand that the better opportunities for the month of September, quite frankly, for most of August as well, have been on the bearish side of things.
So there’s 2 ways to handle it. You look to buy bullish stocks and hedge short sale ideas against your long. So, basically, what that means, just keep it really simple.
If you like stocks to be a buyer, you and I’m going to use round numbers, so don’t let the numbers spook you. If the market is bearish, but you have bullish ideas, stocks you like to buy.
Again, just round numbers, buying a 1000 shares of the stock that you like, and maybe short selling or buying puts of the stocks that are already bearish, which was that big list that I just showed you.
So that’s wrapping up everything we’re setting into the week, but you want some ideas for today.
Right? So now we’re going to actually break down sector rotation starting Monday, and we’ll see how the market unfolds during the week. Remember, we don’t know what’s going to happen the rest of the week.
We have all the information starting right now and how that looks going forward. Well, keep reassessing that as the market unfolds. Very similar to driving. You get on the Long Island Expressway. You’re on the road.
Nobody’s with you. Great. You step on the gas. Get a little closer to Nassau County. All of a sudden, there’s traffic everywhere. You got to slow down. So adjusting and adapting to that new information, is what trading is all about.
It’s not being stuck in your ways. It’s this is what I see before the trade. Now let me pay attention as the trade unfolds. What that means for adding share size or maybe getting out.
So here’s the ideas that we’re looking at heading into this week and how we’re breaking the market down. Okay. So we head our way over into sector rotation. We just showed you that health care rocketed up to the top of the list.
So what does that mean from a trade perspective? Although expected breakouts did not punch higher, they didn’t collapse either with the rest of the market. So relative strength is the play that we’re looking at in health care right now.
So more specifically, health care plan. So we’re actually going up that power pyramid a little bit more to specificity within health care and health care plans.
So you could visualize what the market did last week, and you could see that some of them have not only rallied but they’re sitting right at potential breakout levels.

And this is the list that I’m looking at right now. You can see CI actually a trend going back for the last 3 weeks.
So health care plans. Drug manufacturers, Amgen, and AbbVie are also in up trends and sitting right at levels. Now this is really important. This is what’s happening right now.
These stocks are showing relative strength with the market going down. So it just makes sense that these would be the first stocks that I’d want to look at because they’re already doing what I want them to do, which is going up.
And a lot of people make the mistakes of buying stocks that are going down because of how far they went down, but they are literally not doing what you want them to do.
It’s just easier when you can read the order flow, use your tape reading skills, and say, those are the ones that I want to piggyback. K. So that’s where we’re starting the week out. They could go down.
I don’t care. This is what I’m looking at right now. And as long as they’re doing what I want them to do or expect them to do, I will continue to look at them. If they do not follow through and go in the other direction, that’s fine.
I’ll leave them alone. That’s where you want to get to. Unemotionally saying, alright. That’s what I’m looking for. It’s either happening or it’s not. Alright? So if we continue to work our way through, obviously, we’re talking there.
But although technology is being dragged down with higher interest rates and continuing conflicts, we do not We do have a few ideas here worth heading heading into the new week.
Right? With the type of market we had last week can be challenging to find solid setups, but we actually do have a few in the sector. IBM. Okay. Let’s take a look at IBM, which has also been in a bullish move since the beginning of May.

Look at that trend. Right? Now the challenge we’re going to have here in IBM is whether or not this was what we might call distribution. Look at that volume and look at that big move and it’s pulled back for a couple of days.
So IBM for me right now is actually a new idea that I’m looking at today because of this solid order flow, because of this bullish gap, because of the heavy volume, because decreasing volume during this pullback, and we’re kind of pulling right back to that level.
So if we continue to map out what we’re looking at in some tech stocks this week that are showing relative strength.
The stock shows clear bullish order flow since July, which is really interesting when most the market topped out. So now let’s talk about that.
If we take a very quick look since July, we’re just going to look at this price action here in IBM. And take a look at this price action in the market during that same time. IBM is actually doing the opposite of what the market is doing.
That’s pretty interesting. Right? So we have a potential trade setting up in IBM today. Likewise, Dell Technology continues to show up. Show follow-up buyers since the bullish earnings gap at the end of August.
Friday also shows a well bid candle. So let’s actually take a look at Dell. And pop that in there. Right? Look at these look, first of all, look at Delson’s March.
Earnings report, earnings report, bullish gap, good volume. Look what Dell did on Friday, Thursday, and Friday compared to what the market did. This is a situation where it’s setting up very nicely. And if it follows through, fantastic.
But you can’t tell me there’s no ideas. That’s the point that I want to get across to you. So if you’re having a hard time finding ideas right now, you just need to learn a road map for looking at the market.
And like I just showed you, just doing that little bit of extra 5 or 10 minutes every day. That’s it. Okay? So let’s continue with looking at some of the ideas heading into this week.
So obviously, Dell is looking pretty solid heading into today. No reason to guess we’ll let our order flow and tape reading skills determine the next move. Right? So again, a couple extra minutes of work. There’s the chart of delts.
Tell sticking with technology, what other stocks might be doing the same thing that they’re doing. Right? Couple of other stocks in my watch list, ES TC, which was actually called out by Brad in our weekend game plan call.
Again, that looks pretty solid right there. Got some room to go. It’s got roughly $10. It’s setting up pretty nicely here. Push and a pause right near a breakout level.
I’ll definitely be watching that one this week. So some other ones in here, WDC, Akamai, and BMW. Akamai is especially interesting. Right? Broke big resistance level at 106, closed near the high for 3 days.
So you know what? I’m actually going to do this. Let’s actually show you how we break this down. Right? This is what we call you can actually be building an argument here. Right? So we’re going to actually do that. Let me put this in here.
And this is something that a lot of people just really could really elevate themselves. Something as simple as this. First step, broke a big resistance at 106. Next, clear close near the high for the next 3 days.
Next, produced a bullish gap of both and then a bull flag, which is a continuation pattern and gave us an inside day for a breakout setup. 5 different reasons to consider looking at this stock today.
So I want to challenge you. And that doesn’t even include order flow. The fact that we’re looking at it in the first place, how many ideas when you look at a stock? Do you say it just went up yesterday or a meta scanner?
And I’m going to look to buy it. That’s not enough. You want to build as much into that argument as possible. If I’m going to take risk and put my money in harm’s way, you better have some good reasons to do that.
And the more reasons you could put into that trade, your conviction level goes up. But here’s the thing. Even doing that, there’s still going to be some fantastic ideas that don’t follow through.
And I’m keep touching on this because I know it’s a very sensitive subject right now some people are feeling like they’re getting their head beat in by the market every day.
This is where you recognize what’s going on, lower your initial position size, look for some good ideas, preserve your capital, preserve your mindset, make some cash flow until the market picks a better direction for the way that you trade.
So if we continue to work through this, That’s 5 reasons to potentially be looking at Akamai today.
And if we kinda zoom out a little bit on that chart, you can actually see It’s kinda setting up a 2 step trade where this pause has another 12 to $14, but here’s the price action.

Over the what did the market do the last 5 days and look at what this stock did?
Just these little clues, right, putting that into the equation. So kinda working our way through. And other sector is crude oil. Obviously, energy, crude oil getting all that attention.
Obviously, crude oil had that $90 headline, right? So we don’t want to ignore some of the energy stocks that we’ve been watching over the last week, month or so. And here’s another one. Right? So VLO, MPC, CCJ, PBF, and PSX.
Right? Probably the one that I’m watching the most today is this one right here, and you can actually see MPC going all the way since July. Again, the market pulled back in July energy took off our community focused on energy stocks.
We’re following in piggybacking, but you need that roadmap first. Right? You need to understand order flow. This last push and pause, a push and a pause.
Now we’re not going to guess we’re going to let it unfold. So here’s what it is. 157 would continue and validate this buying pressure, 15750, and below that at 152 would say this trend is over and start to look for something else.
No guessing. Just mapping it out. Here’s what I expect. Let’s see what happens. Alright?
Obviously, we’d love to see bullish momentum into the week. I’ll take stocks that paused as a sign of relative strength. And now we’re going a little bit deeper into the sectors We were looking at Allstate, travelers, and chubb.
Allstate broke out and pausing right at that breakout level. And you could see a few of them doing exactly the same thing, same thing with CB.
So I want to get across here, and I hope this is really coming through that when you have a structure for price action, Everything is easier because you’re no longer predicting. You’re no longer guessing.
You’re no longer forecasting. You’re simply saying, I understand what perfect looks like. Now I’m going to go out to the market and say, do I see anything perfect? If yes, go get them. If the answer is no, you just leave it alone.
And then you wait until what you see is there. Now there’s different degrees of trading. There’s perfect and then there’s, that’s still pretty good. And that one maybe. So the further away if you get from perfect, here’s the key.
You can still Take those ideas if they meet your strategy, but if they’re moving away from perfect, that means that we should also be reducing how much we’re willing to put into that trade because it’s not perfect.
I hope this roadmap is really helping you understand. There’s ideas out there.
There’s stuff to do. And some of them are perfect. Some of them are slightly away from that. Some of them have potential change of trend here. If you understand the bearish side of the market, there’s plenty to do right now.
This is what trading is all about, and this is really what trading has become the world’s greatest business for you. If you just simply have the road map and give yourself a chance to understand how to use that roadmap.
Alright? So that’s our game plan for the week. Look, if you want to join me, we have a newsletter that you can get and give you this from start to finish every single day. There’s videos.
There’s a course. There’s a whole bunch of bonuses in there. It’s $297 for 90 days with a 30 day money back guarantee. You want to get this from me every single day and get my setups, click that link down below in the video.
I’d love to see you there. If we did a good job today, do me a favor. Give us a thumbs up. Hit that subscribe button, and I’d love to see you soon. Alright. Have an awesome day, everybody. I’ll speak to you soon, and have a great week.


Responses