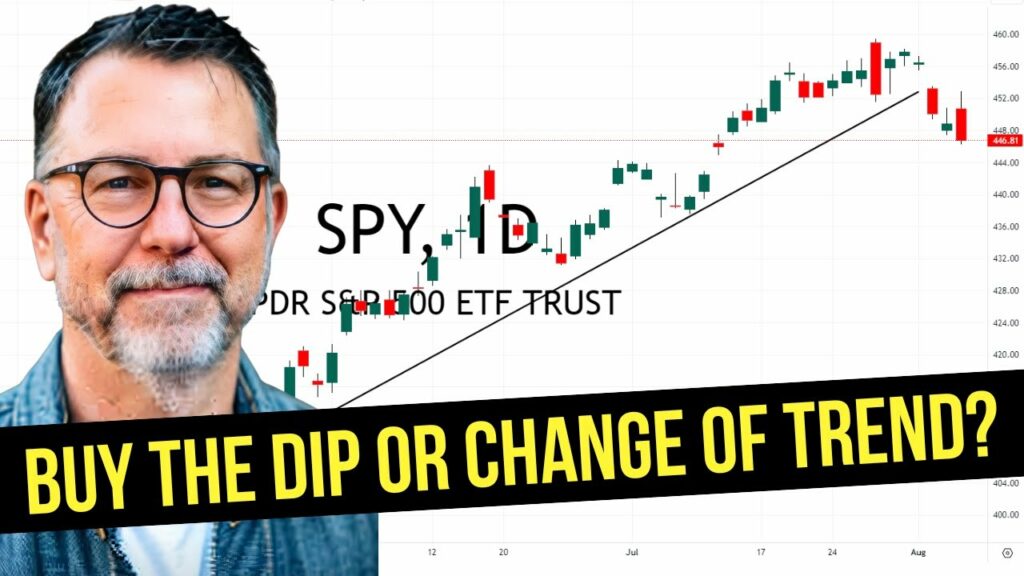
Stock Market Faces Critical Test
Outline
- Introduction
- Discussion about energy stocks and their performance on Friday
- Mention of sector rotation and order flow analysis
- Analysis of Specific Stocks
- Mention of M, TDR, and SM stocks and their performance
- Observation of buying coming back consistently in the sector
- Noting that some stocks are at or near breakout levels
- Energy Sector Stocks
- List of stocks in the energy sector, including CPE
- Highlighting that some stocks are at new all-time highs
- Technology Sector
- Focus on NET stock and its price discovery pattern
- Noting the importance of a specific level (72) for potential entry
- Other Stocks and Sectors
- Mention of IBM, PLTR, and SMCI stocks
- Discussion of industrial stocks and oil and gas EMP sector
- Conclusion and Additional Resources
- Encouragement to watch the video multiple times
- Mention of blog post with transcript and opportunity for further discussion
- Closing remarks and call to action for viewers to subscribe and leave comments.
Summary
In this video, Pete discusses various stocks and sectors and provides insights into their performance and potential opportunities for investment. The video begins with a discussion on the energy sector, highlighting stocks such as Matador Exploration (MTDR), Godfrey Phillips (GODFRYPHLP), and Sempra Energy (SRE) that are showing relative strength and are at or near breakout levels. Pete emphasizes the importance of considering the overall market trend and stacking reasons for accepting risk when choosing stocks.
Moving on to the technology sector, Pete focuses on Nets (NET), a stock that has experienced price discovery at the 71-72 level multiple times. Pete explains that they are waiting for the stock to surpass the level where the earnings gap occurred (around 72) before considering a potential investment. They also analyze the reward potential if NET breaks through this level, pointing out minor resistance levels and a potential 50% move if the stock can rise above 72.
Pete then discusses other stocks and sectors, including IBM, Palantir Technologies (PLTR), and Super Micro Computer (SMCI). They highlight the importance of pullbacks and breakouts in industrial stocks and mention Caterpillar (CAT) and Eaton (ETN) as potential opportunities. Pete also mentions the blog post where viewers can find the video transcript and encourages further discussion and feedback.
In conclusion, Pete emphasizes the significance of order flow analysis and sector rotation in identifying potential investment opportunities. They mention the large number of stocks with stacked bullish order flow in the oil and gas EMP sector. The video ends with a call to action for viewers to subscribe, leave comments, and watch the video multiple times for a deeper understanding of the content.
Stock Trading Pro. More importantly, welcome to stocks for breakfast, where we set up the entire week this week. Top to bottom. Look at the stocks. Look at the market. Look at the industry groups going to get a little bit into some of the swing picks that I’m looking at this week. We have 1 big pick from last week that actually 2 weeks ago.
That’s still in play. We’re also going to talk about something shattering. Probably one of the biggest myths on Wall Street, which is when last percentage and the reason I’m bringing this up is because we had some pretty easy trades for the better part of the entire last quarter. We’re starting to see a little bit of mixed earnings coming in this.
quarter. I would say the last couple of weeks started out with banks, which are actually pretty good. And we’re starting to see stuff all over the place. Now we’re seeing gaps down or gaps in the other direction. So the probably the bigger ones that we’re more concerned with right now are the quote unquote magnificent seven.
They’re all over the place. Apple did not have good news last week. Tesla’s right on that bubble. So here’s the big thing I want to get across. And this is really important for the entire video that we’re about to discuss. This is a really crucial week for the stock market and just as importantly for you, how you react to the market being anything less than perfect is going to say a lot about your long term philosophy about what trading actually is.
And the fact that it is a business, the fact that it is a skill, the fact that it is probably the world’s greatest business you could ever get involved with no nights, no weekends, no holidays, no employees, all of those things make it fantastic. You just need to make sure you maintain your sanity as the market pulls back a little bit over the last week or so and whether or not the market faces this crucial test this week.
And do we catch a bit? I know the futures are actually up a little bit. We got some more big earnings this week. One stock that I want to talk about that has earnings, we’ll take a look at the date that is scheduled announcement. It’s right out of the bubble. of the level that we would look at for a massive short squeeze.
I’m going to point that out to you today. It’s going to be fun to map this one out over the next couple of weeks. Also, since it’s Monday, we’re going to look at some ideas this week. What we’ll do today is if you have any ideas that you’re looking at this week if we have a chance, type them in there.
And if we have a chance, we’re going to run through those stocks as well. We got a ton of stuff to cover today. We also have an options breakdown by John Napolitano that we’re going to go over today as well. Just want to make sure I say hello to Simon. Good morning, Simon. Jody Lash. Good morning, my friend.
How are you, Joseph? Good morning. So I want to thank everybody for being here with me. Stick around, be back in just one second. Okay, so as with everything we do on this channel, everything here is for educational purposes. I’m showing you what I’m doing. It’s up to you to make the best decision for what you do.
Now, we’re actually going to start out with, I want to break this down, we’re going to get a little bit into what’s going on with earnings this week. But when we get into that, I first want to actually head on over into probably one of the most popular stocks, I guess you would say, which is Tesla.
And if you remember last week, we actually broke Tesla down and like right over there is where we were looking at it. And we said, oh man, Tesla broke this big move to the upside, has not been able to recover from the earnings gap, which it did over here. This is really the interesting part. This is roughly the same exact conversation.
Where earnings guidance was okay, but more importantly, margins started to shrink and we’re in that. Look at that. The language I want to use for you right now. It’s something that we talk a lot about behind the scenes. I just noticed how much I’m moving my hands. Somebody called me out on it last week and I don’t know.
I don’t think it’s because of Italian. I think it’s because I just really like to get my point across. Oh, my gosh. That’s so funny. Anyway. What we talked about something I want to get across to you is something called price discovery. Once you get this theory in your mind, and once you get this concept in your mind, you’ll understand how price moves back and forth a lot better.
And that’s actually going to bring me over into a different trading idea. I’m going to use AMD as an example of a very popular, I should say, very common trading setup, or trading thought process that I absolutely do not like and I’m going to show you why and I’m going to explain to you the reason behind it.
One of the biggest things that we do in our community is I never just say because remember when your mom or your dad said that when you’re a kid, you’re like because of your mom or because of your dad. We hate that. I never do that. I want to explain what it is. I have a particular thought process around that.
I just want to make sure I say hello to Tim today as well. Tim. Good morning. Thank you so much for being a part of our community. Really appreciate that. So the big thing I want to talk about with price discovery. Anytime you are looking at a stock, buyers and sellers are basically looking for. Where is the supplier demand and can I push it through that level or are they going to hold now?
We’re actually seeing that in Tesla. We can zoom on over into Tesla right here. It’s price discovery now When you draw trend lines, which is probably one of the most exciting things that I like to do No moving averages. None of that other stuff I do use those but not what I’m actually digging into the charts and looking for an idea once a trend line is broken you have to let it float down to that spot and Then when it stops and starts to head in the other direction you have a new line Now, what’s interesting about Tesla is we have a much bigger box, and then within that box, we have another one.
So we got a lot of people asking us about Tesla and whether or not Tesla is a trade right now. For me personally, right now, Tesla, two consecutive quarters of lower margin, increased competition, and of course, they have that celebrity CEO, right? Working our way over to whether or not it’s a trade.
Right now, as of this moment, Tesla is still in a uptrend, still in bullish order flow, but we have a box within a box. So there’s really no trade for me at Tesla right now. As a matter of fact, we’re still looking at price discovery to determine whether or not it’s going to confirm or validate, which is now a PCOT, which is known as a potential.
Change of trend. So for me right now, just to be super clear there, everybody, I’m not looking for a new trade in Tesla right now. I need for price discovery to resolve itself, get out of this box before I put on a new trade. Remember, the entire reason we choose to accept risk is because the likely profit potential justifies the risk we need to take on that initial entry.
So if you happen to be new to our channel, I just want to make sure that I give you the full Monty on everything that we look at. There’s order flow, and more specifically, order flow stacking. And can we identify where the smart money footprints are pushing stocks up in the case of buying opportunities, and how long have they been doing it?
Order flow stacking is how long they’ve been doing it, and can we spot, is it more obvious in a particular sector or an industry group? And that kind of increases the likelihood of the profit. Likelihood, nothing’s guaranteed, right? Then we move from Order Flow to Tape Reading. Tape Reading is determining whether or not Order Flow is still valid right now and whether or not we should be looking for a new entry.
So raise your hand if you found a stock that you thought was super obvious but then it went down, it pulled back against you. So having that second part of the equation, we keep it really simple is it obvious and is it still valid? So those first two parts we need to consider before we even start to look for an entry.
So if we could tie that back into Tesla right now, It’s still pretty obvious, but it’s not valid right now. So there’s really no reason for us to be looking for an entry. So then the second those are the first and second parts. The number three and number four are the actual trade part, which is number three is the optimal entry.
So that means at the moment we’re about to hit that buy button, is there sufficient likely profit potential to justify the risk? So in other words, if I hit that buy button, is there enough room to justify the risk? So that’s number three. Number four, I think, is the part that a lot of really smart traders struggle with, which is managing profitable trades.
And we’ve had a really good run now, probably all of 2023, between some of the tech stocks. And I’ll show you one of the ones that I think is the most exciting for this year. Probably doesn’t get enough love, is SM C. Look at one earnings report to the next. This is just 90 or 80 something dollars to 300 and change.
This is one of those situations where just one trade can completely change. And one of the things that we talk about him and my philosophy. is just one winning trade per month can change your entire life. It could fund your retirement account. It could get you there a little bit quicker. Now, again, I don’t know you personally, although some people I don’t know what your resources are.
I don’t know what your skills are. I don’t know what your discipline is. I don’t know the size of your account. But it’s a fun thought process. You want to be moving towards something. And if you think about understanding one winning trade and managing that one winning trade could make all the difference in the world.
And we’re only talking about one winning trade per month. Now, that doesn’t mean we don’t have losses. Small losses, small profits. Small losses, small profits. And a few of them follow through. That’s the philosophy of some bigger traders and all the seven figure traders that I personally traded with myself.
Now we want to work our way over it to the second part where I talked about price discovery and a big trading strategy that a lot of people are familiar with that I just, I absolutely can’t stand. And I’m going to show you a chart of AMD. AMD is probably one of the more popular stocks that we’ve traded in our community over the last couple of years.
And you can see now is what a lot of people might call channeling. And there’s a lot of people that might say, buy the support and sell the resistance, buy the support and sell the resistance as opposed to looking at something like this. So I really want you to train your eyes to look at this where you can clearly see there’s a bias.
Somebody’s in charge of that stock, and then maybe on a pause like this or on a pause like this, we could hop on board, right? And then your eyes now should be completely trained to look at that where there’s no bias, right? But this is really the one that I want to talk about right here. There’s a lot of people out there that love to trade buy support, sell resistance.
And while it’s stuck in that box, I want to take you back to what I just talked about before about order flow stacking. The only reason we should choose to accept risk is because there’s a high likelihood of it moving in that direction to justify the risk. Now, when you see a stock that’s going sideways, that’s channeling, I understand that you could look at it and say, there’s the support, there’s the resistance, right?
And trade around that. But just identifying a risk point does not make it a strong edge. It simply means that you are managing the downside with clarity, but that doesn’t mean that there’s a strong expected Follow through. Okay very big difference. So what we want to do now is we want to tie this into a whole other lesson on risk reward.
The reason I’m bringing this up, I really want to bring this out. This stock right here, Disney. I want to, I’m going to bring that up. Actually, you know what? Let’s go to Disney first because I want to really bring this point home. We get a lot of conversations and zoom. Let’s actually go out to the weekly chart here in Disney, zoom out Look at the support level on Disney right now.
That’s where it broke out. Support. And now we’re coming into this week where Disney has scheduled earnings coming out on Wednesday. So why am I bringing this up and such, like I’m so excited about this. Disney right now has been getting beat up. It’s had a lot of bad press lately.
For all the reasons that you could possibly imagine. If you’re a superhero fan like I am, Marvel’s Secret Wars was a disaster. It wasn’t even that good at all. But let’s talk about this from a trade perspective. When do short covering rallies happen? Now, if you don’t know what a short covering rally is, if you could imagine a stock going down, and all of a sudden, as it’s going down, it slows down a little bit and stops going down.
So people that are betting on it going down are short sellers, right? So in order for a short seller to make money, it has to go down, and when it goes down, they have to buy that stock back to get out of the trade. That’s called covering. So if you short sell a stock and exit that trade, it’s a cover of that short.
It’s also buying that stock. You have to buy back something that you sold. Now a short covering rally requires a move to the downside. And then typically once it stops going down, short sellers have to exit the trade, so they have buying other traders who recognize that it stopped going down, hop on that, so now you have two different groups of people buying, you have short covering, and you have new buying, and those kinds of moves can happen very fast.
So that’s a short covering rally. Now, I want to be clear about this. As of this moment, Disney is at a very critical support level with earnings scheduled to come out on Wednesday. Now, what we are discussing here is if Disney punches through that support level, which again, I’ll show you that chart really quickly here, you can see how significant this is going all the way back to 2015 for whatever reason, this 85 to 87 level is very significant.
If Disney trades through that level, and then within the next day or two recovers. Now, the reason I’m saying think about the short ideas or the buying opportunities that you take. A lot of people trade breakout or breakdown strategies when they’re really obvious. A lot of people hop on board. But when those obvious setups fail, so in other words, big level breakdown, and then immediately comes back, so we might call that a bullish U turn where it traded down and came back, or a well bid candle where it traded down, and then the next candle has a higher high and a higher low, so generally within two days of the breakdown.
If it breaks down and pauses, generally speaking, we’ll look for follow through. What we’re looking for here is a different scenario to really be on top of. The higher probability trade is the push down and pause looking for another move down. But short covering rallies can be like lightning in the other direction.
So what we need to watch this week with Disney coming out with scheduled earnings on Wednesday, If it breaks down and recovers in any one of those two chart patterns, I just said we could conceivably get a very fast move in the other direction because short sellers who sold the breakdown have to buy it back because it failed going down and new buyers coming in seeing the failed breakdown.
and support that major support level. If we break down and get back above this level, we could see a pretty fast move in the other direction, a week or two, maybe three weeks in the other direction for a very quick, active trade. Now requires you to have all that mapped out. That’s a very important point.
When you know what you’re looking for, you never lost, but just as important is when you know what you’re going to do next. All the stress goes out of trading because you’re not guessing anymore. You’re not predicting anymore. You’re saying, if this happens, then I plan to do this. What is all that broken down by?
Order flow, tape reading, optimal entry, manage the trade. We just talked about managing a profitable trade. Now we’re talking about if something happens, breakdown and reversal, short sellers could be spooked and we might see a very fast move in the other direction. It’s a little bit of an advanced trade.
Remember everything we’re talking about here is. education. It’s up to you to determine which of these kinds of ideas match your particular skill level at this moment. But even if you’re not going to trade it, it’s fun to still watch it play out because I don’t know if L. J. Is on the call with us right now.
But L. J. Asked a few times about how do we know When a potential short covering rally will happen. And the question comes from because when they happen, you want to know they are like lightning in the other direction. So something for us to keep an eye on as a community this month. All right, let’s say Tom is looking at Baba.
Let’s take a quick look at Baba. And then I want to get into the rest of the stuff that we’re keeping an eye on. So here’s actually a pretty good example what we’re mentioning, right? Can you look at BABA right now and say that there is a dominant side in this stock? Maybe over the last couple of weeks, but what is the likely profit potential?
We have resistance here, right? We have a big wall of sellers here at 102, and then it looks like we have a gap fill up here towards 116. So here’s how I want to map this out when I’m looking at an idea. I want it to be so obvious. I could explain it to a five year old and say, my gosh, look at how slanted that is.
And there’s nothing in the way. So something else that we break down. For example, in this trade in Baba, if I had a scale. Where I’m looking at an idea and I say I want to grade it based on 1, 3, or 5. 5 meaning I love it. It’s an optimal entry. There’s plenty of room to go. The sector, the group, and the market are all lined up.
I’m going to get in there. Not only get in there, but I’m going to get in there with a little bit bigger position size. would be maybe 3% of the trade. We like it super strong from a stock perspective, maybe even the industry, but the market’s not obvious in the bigger sectors, not on board. You can get in there and start a position with conviction.
One would be you have a stock specific idea, not necessarily perfect, but maybe over the last couple of weeks you saw a little bit of order flow stacking where you can justify you looked at the chart, you saw higher highs, higher lows. But still not perfect. So if you look at that and take a look at this chart, can you look at this right now and say, man, this is perfect for me personally?
No. So if I’m looking at this right now with resistance, not too far stuck in kind of trading ranges, a gap fill over here and major resistance here, decent amount of room. But for me personally, again, I’m not telling anybody else what to do for me personally. If I go one, three, five, if I was leaning on that most recent.
stacked order flow, which is maybe a couple of weeks and the fact that there’s resistance and a much bigger, wider trading range. For me, this would be a lower initial position size, probably a 1, not a 3 or a 5, because I think it’s okay. Maybe a starter position so you could read the tape.
Not a lot of risk on and you have it in your position somewhere where you could read it going up or down. If it starts to move in your favor, maybe you could consider adding to it. But here’s the big part of trading. You have to think to yourself, is this the best idea I can find right now? Not, is it an idea we can build an argument for, is it the best idea?
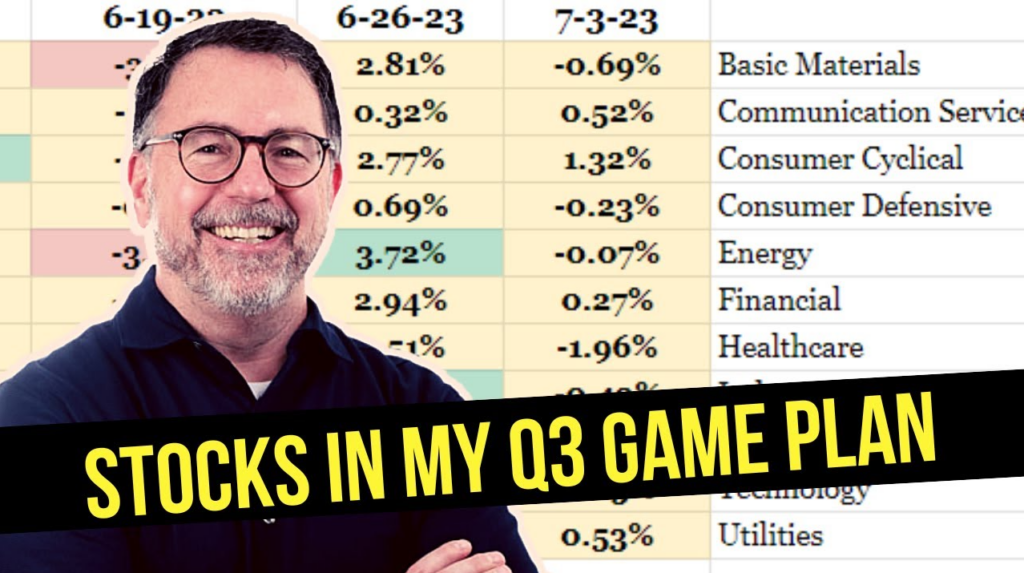
For me personally, I think it’s okay. I would be looking for something a little bit better. Now, what does that look like right now? So we’re actually going to break down and go through sector rotation and take a deeper look into the idea of what’s going on in the market. And we’re going to break things down also from the perspective of win loss percentage and why I can’t stand that metric.
So you can actually see we break down the entire market for the entire week. This is the big thing. The market faces a crucial test this week, right? Mixed earnings, guidance, or bullish gaps. And we saw that on both sides of the market, where stocks like Apple took a hit in the other direction, right?
Or we had stocks like Google with a big bullish gap, but even Google hasn’t been able to really hang in there and hold that bid. So we had a big gap up, hasn’t been able to hold, big gap down and continuing to go down, right? So mixed earnings, all boats are not pulling in the same direction, which means we get strategic and focus more on sectors and groups.
And that’s actually what we’re going to focus on over here. If the bull market remains, the market should rally this week. So I want to be clear about that and what I’m actually setting up for myself. For the week, we had some earnings come out. We had a big move up in the market. The market’s pulled back a little bit.
Nasdaq pulled back held support. The spy actually traded okay. Last week, not great, but okay. So we basically had a five to eight day pullback. So the way I’m looking at it is if the market is still bullish and that bullish tone is under the market. We should go up this week. A lot of our market internals that we watch for the community we have one that’s called a 20 day high Versus 20 day low breakout versus breakdown now that was pretty bearish for a few days and now it’s getting less Bearish.
So in other words, there were more breakdowns 20 day breakdowns Then there were 20 day breakouts and that was a big number was down here and that was let’s say that was Wednesday and then Thursday was a little bit higher and Friday was even a little bit higher so it started to trend up less bearish but not yet bullish and if I could show you actually what that looks like let’s actually do that let me break that down for you.
And if we take a look at the metrics over here, let me zoom over a little bit and right here. So what we’re talking about, basically, let me zoom that out a little bit so you can actually see it. We’re talking about right here. So this is still bearish. This is actually coming back a little bit, so less bearish, right?
So you can actually start to see that it is starting to not push down, came back a little bit, and then obviously we had that big meltdown in the market on Friday. So we have the big picture pullback, we have the market internals a little bit less bearish, but not quite as bearish. This is a critical week for the bulls to make a stand.
Now, here’s the thing. We had really easy order flow to read. I don’t want to say easy trades because I don’t know how everybody can trade. We had really easy order flow to read. We are now in a state of the market where it’s a little bit less obvious across the board. And that’s going to be a test for not only for the market, but for you and how you mentally handle.
Trading an opportunity that is less than perfect, and we actually see with new members coming into our community. They get a little bit freaked out with perfect, and a little bit of a pullback, and they’re panicking, and we have to teach them. You got to think the long term, and I’m going to show you what that means right now.
Okay. So again, want to work our way through this. All right. If the bull market remains in tax, we should rally this week. We mentioned that during the recent decline, we saw lower lows lower highs and many popular stocks threatening to confirm various change of trend, which is what we just talked about here in Tesla.
So you’ve got to keep this in the back of your mind. So now you should be thinking to sell 1%, 3%, 5%. There’s different risk levels based on the quality of the idea. And now we’re going to start to break into those ideas from a sector specific play. And if you just happen to tune in, we’re going to be talking about energy stocks in a big way.
And there’s some news from the Saudis that they are cutting again. So we’re actually, crude oil is actually at a big level. We’re going to take a look at that in a second as well. Okay. So you, I’m talking to you, right? You will also face a critical test. at a critical moment this week. 2023 produced some massive wins.
Dare I say some easy trades, you might say. So here’s the thing. How will you react when those profits that are so good that you had to work hard to mess up become small profits that turn into small losses? So basically what we’re saying here right now, and this is a really advanced thing, this is something that.
I talk about in our community. It’s something I talked about when I owned my trading firm, was that you have to react differently to different market conditions. But that means you need to know what great looks like first. So remember the quote that I said before, all right, when you know what you’re looking for, you’re never lost.
But this turn the page and the next page of that says, That means you need to pay attention to what kind of opportunities are in front of you, and then adjust your position size and your expectations with the quality of the idea. So May, June, July, amazing trading. August, a little bit less obvious, which means that you, me, all of us, have to adjust our expectations for follow through and how much risk we are willing to accept.
Simply because the conditions changed. So again, I like to keep things simple. I like to have you think about something. May through June, you’re driving on the Long Island Expressway, 495. You’re heading out to the Hamptons. Nobody’s on the road, but you great. Got the, I had the beach boys playing when I lived out there, August, a little bit different.
We get a little bit closer to the Hamptons. And now all of a sudden we’re in stop and go traffic. Everybody’s jammed up. We have to pay attention. So if you learn nothing else from me ever, this is the biggest thing. All situations are different and you will amplify your results dramatically. When you understand to pay attention and understand that you have to adjust how much you’re willing to put into the deal based on the quality of the idea.
And remember, those four steps are very easy. Order flow, tape reading, optimal entry, and profit maximizer. Okay very simple. By the way, if you want to learn more about this or possibly talk to me about getting into our coaching program, there’s a link to Our support email is below in the description.
If you want to find out a little bit more about working together, just no pressure. Just click that link down there and email us. All right. So anyway, let’s continue to get through this, right? So some simple math to keep your sanity right now and some context. One of the biggest myths, I believe one of the biggest garbage in all of wall street is win loss ratio.
We get people all the time. I got an 80% win loss ratio. I don’t care. I’m going to tell you why. So many brag about it, but it likely means you are cutting your profits short. I’m sorry, but that’s a fact. Anybody who is consistently bragging about how high their win loss percentage is, they are likely taking a profit as soon as they have it, instead of doing what we’ve had in some trades like this, just to give you an example, where the entry was here, the simple breakout, and we had basically a…
3850, I believe was our entry and 90% move. Now, if we would have took the first profit here, as soon as this thing took off, we would have been like, yeah, big win loss percentage, right? Booking that profit. That’s not how big traders make money. Big traders, milk. every single trade for every penny it’s worth, but they also have very clear signs of when it’s reversing, which in our universe is the profit maximizer.
We always have initial profit targets for trades that justifies the initial entry. But then when we hit the initial entry, excuse me, the initial profit target, then we shift over to profit. Maximizer mode now I’m going to I’m going to you’re going to want to screenshot this. So I’m going to tell you this ahead I don’t normally give out swing trades the exact ones that we do But I think this is a really important lesson for you to understand how to structure a trade From start to finish so that you really think through how do I plan to manage this trade both in my favor or against me?
So what I’m about to show you are two ideas that I’m looking at this week again. I don’t normally do this, but I’m going to show you the entry, the stop loss when I plan to add shares, what my initial profit target is, and then after it hits, if it hits my initial profit target. Then I will shift over into the profit maximizer and see how much more I can get out of that trade.
And before I do that, though, I want to show you why this is so important and why win loss percentage is garbage. And keep this in your mind, because every time you have a losing trade, you have to say to yourself, Was it a good idea and would I take that trade again? So here’s, I’m going to first show you the numbers and then I’m going to show you those two trades so you can actually map those out for yourself.
Okay, so the big thing I want to talk about is this. Okay, let’s let some simple numbers click in. Let’s say that we’re two to one, not even a big three to one, but let’s say two to one. You can get that day trading or swing trading. It doesn’t make a difference. And let’s say you have a 50%. win loss percentage as long as you are earning a reasonable amount on your winning trades.
50% 10 in wins 5 in losses even at a 50% only two to one you’re still making money. So every time you take a loss dial down the stress and remember it’s a part of the process and here’s where it really starts to get a little more exciting. Let’s go to three to one which is what we typically look to look for on our overnight exposure swing trades and now we’re talking about a 40.
percent win ratio, but you now understand how to hold good trades longer. This is why I said before, only one good winning trade per month can completely change your entire life when you understand this principle. Four wins, six losses, twelve dollars, six dollars, still profitable on only a forty percent win ratio.
Now here’s the, beyond a shadow of a doubt, the most important part, and I want to actually highlight this because it’s that important. Remember what I just said before about understanding 1%, 3%, 5%, right? These numbers, the 3 to 1, the 2 to 1, do not take into consideration position sizing for ideas that have stacked order flow, which I also just talked to you about, or holding good trades longer.
That’s just you’re only getting 3, okay? Which can make these gains Much, much larger. Now we’re actually going to go all the way down, and then I’m going to come back up to sector rotation and the options stuff, right? So we’re going to go over here to swing alerts. So you can actually see the way that we break the trade down.
You have all the reasons. We have the chart for SWK pulling back, trading it to one of my favorite patterns, which is an inside candlestick, bullish gap after earnings. I’d like to see it get back above the earnings gap, but that’s another conversation, right? This is the most important part right here.
Okay, we broke down the trade. We broke down the risk reward. We broke down our initial risk. Our initial target entry stop loss. First two parts of the trade are mapped out. No guesswork. No nervous. Nothing know exactly what I plan to do. What if the stock moves in my favor? I already have it mapped out when I plan to move in my favor.
And how I plan to manage it, right? Then remember what I said before about our initial risk Justifying our likely profit, but then I also said that we manage the trade Differently once it hits our target, which kind of takes us all the way back up over here to the risk reward numbers right, so we work our all the way down here the initial profit target is nothing more than What we are justifying to take this risk.
So let’s just map that out again. We have the entry mapped out. We have a list of reasons why we like the trade. Earnings, pullback, inside candle, a whole bunch of other things, right? Then we have an entry where we want it to be moving in our favor. We want some positive feedback before we get in. We’re not just buying for the sake of buying.
We’re buying because it’s moving in our direction. And we have the whole trade mapped out. We have the reasons. We have the entry. We have the stop loss. We are looking for positive feedback on the trade. If we get positive feedback and it moves a certain distance in our favor, then we already have it planned out when we plan to add more shares to a trade because it’s giving us positive feedback in the form of price action.
That stacked bullish order flow is coming back in and pushing it in our favor. Then if it continues and hits our initial profit target, Cool but then we also have a plan for that after and if it hits our initial profit target, then we shift to profit maximizer mode, which means now we’re going to let that stock continue in our favor and hold it until we see the profit maximizer has been violated.
And then we decide to get out. So that’s where those three to one trades. that are what we are. The minimum we’re shooting for to take that risk. We’re looking for 3 to 1 to become 6 to 1. And then that completely changes everything when you add holding good trades longer and you add 1% 3% 5% where you understand each trade deserves different money into that deal because you can now recognize the quality of that deal.
Everything changes going back to win loss percentage. Who cares about the trades that don’t make money. You didn’t get feedback that you wanted. You accepted the risk before the trade, you kicked it out part of the math. And then you just go to find the next idea and you keep your sanity. That’s how you turn trading into the world’s greatest business.
It’s planned from start to finish. You’re never taking big risk unless the idea calls for it and justifies it. And then even if that trade doesn’t work out. If you can say that was a great idea, I would take that trade again, and that’s where you’re really starting to level up as a trader because now you’re running it like a business as opposed to hoping something happens, you have everything planned out from start to finish.
I really hope these lessons and the context of what we’re talking about right now. Makes you think a little bit differently about what the stock market actually is. Companies are reporting cash flow, they’re reporting earnings, and those numbers are going to make those stocks go up and down. That’s what the supplier demand is, right?
It’s our job to spot those smart money footprints, see how long that order flow has been stacked, and then make decisions about whether or not it’s a good idea. So now I’m going to finish up here, you might have to watch the video again or pause a little bit, we’re going to go through the sector rotation and the energy stocks and a couple of other sectors that I’m looking for, so we’re going to go from the market, which we just talked about, to the sectors, to the industry groups, and again, I hope that I’m inspiring you to just think through a little bit deeper, spend an extra 5 or 10 minutes every day saying what’s going on with the market, and how does that relate to what I should be doing Thank you.
With my open positions or maybe even thinking about some new ones. Okay, so we’re actually going to hop on over here and We are going to head on over into oh, by the way, if you want to read this options newsletter We’re actually going to go here. I’m actually going to post this in here and I’ll put it as a link Below John Palatano or options trading pro wrote a whole breakdown on a different perspective what we just talked about on whether or not the market is cracking or whether or not especially Nasdaq is in an early stage breakdown or if it’s pushing down to find support.
So click that link. I’ll post that link in the description below as well if you happen to be watching this on the replay. Okay. So we’re going to break down now the sector. So energy stocks. Write that down. Energy stocks held the bid on Friday. As the rest of the market spent the afternoon collapsing. So if you’re not aware of what the market did on Friday, just to give you an idea, this is what the market did, right?
So now we’re talking a little bit about what’s going on in some of these stocks. So M, TDR and SM. So if we hang out and put this in perspective, you can see what these stocks are doing. Not only did they. trade higher, but they closed near the high and they’re actually near a breakout level. So you can actually stand not to see where sector rotation is a little bit different from getting a read on the market and now going a little bit deeper into the order flow.
And you can see buying coming back week after week after week. These are the visualizations of stacked order flow and sector specific stacked order flow, which is why I’m really leaning on. Look at this relative strength compared to some of the other ideas that we just take a look at. So as we break our way down into matador matador, God, empty dr and S.
- You could actually start to see at or near breakout levels or clearly clearing breakout levels. Now again, in this sector, we’re seeing stocks at new all time highs. That’s a clue. Remember, we’re stacking the reasons for choosing to accept risk, right? So stocks in the game plan, this is a bigger list of stocks in the energy sector.
And you can actually see CPE is also at or near an optimal entry here. Technology, looking for market leaders. Here’s one that I want to talk about that is really interesting. You could take a snapshot of this as well. Nets. This is one we talked before about price discovery. This is a fascinating one of price discovery.
One, two, three, four, five different times net traded at the 71 to 72 level. That is a perfect visualization. a price discovery. Now, the big thing I’m looking for in this stock, I’m not looking to buy it just because it broke out and earnings was reported. I want it to get above the level where the earnings gap happened, which in this case here is 71 78.
So let’s say 72, so you can see it’s actually below that. Now, again, this is where you know what you’re looking for. You know what you need to do, and you don’t do anything until it happens, so you set an alert. That’s what I’m doing at 72. If it gets back up to that earnings gap, and specifically where it gapped that morning, then I will look at it and consider whether the risk reward and the order flow is stacked enough, but that’s a big level.
Not only is 72 a big level of price discovery. Again, let’s keep this as simple as possible because you want to make it. trades with conviction. 72 is a significant level. But then we got to say, is there reward potential if it finally gets through? Remember, does it justify the risk? Okay, so if we take a look and zoom out a little bit on net there’s minor resistance here and then there’s nothing.
Probably the next big level is up over here where you could see again. Wow, look at that. Support resistance, couldn’t get away from it, and resistance again. So we’re essentially looking at almost a 50 move with a little bit of resistance over here if net can get back above 72 and volume actually punches up there as well.
So remember, if, then, if, then. I want to be clear, I am not saying I’m getting involved now. I’m saying it’s super interesting. A lot of price discovery around that level 72. It gets back up there. It’s going to have my attention again. So let’s keep an eye on that together as a group as well. All right, so let’s wrap up and head down into the rest of the ideas that we’re looking at from a sector rotation perspective.
We talked about IBM a little bit. PLTR has earnings scheduled this week. Be aware of that. SMCI, we just showed you that stock as well. I want to go through this so you can actually. Pause this and take a look at some of the ideas how and why I’m also taking a look at these ideas as well Okay, so you could actually see another stock that has plenty of room to go So you’re starting to see we’re looking at here if I’m choosing to accept risk I want there to be reward potential so that it justifies the risk as opposed to something like this Where right now that’s the right price and I’m going to leave it alone until something happens.
Somebody comes in there and disrupts it Industrial stocks. I like to pull back and cat a couple of other ones. Etn bullish gap pause like that one as well. All right, so you can pause this. Take a look at some of the ideas pulled back to the breakout. Another great example of a breakout after reporting did not hold it.
And this is where a lot of people oh, it’s going on the market. We pulled back. Let’s see if holds the bid this morning. And now we work our way into some industry groups, specifically in the industrial area and also into oil and gas EMP. And this is probably one of the biggest things right here, have the largest number of stocks with stacked bullish order flow.
Covered a lot here today. I really hope that you watch this video more than once. And I want what I also want to tell you as well. I’m going to give you the link right now. Make sure you hit the blog. Because if you go to our blog and I’ll leave this link below as well. We covered a lot of really interesting things today.
So I’m going to put this video on the blog and I just put the link in there and I’ll put it below. We’re going to give you the transcript of today’s video. So when you go to the blog post for this call, you’re actually going to see the transcript right below the video. You can copy and paste it and print it out, highlight some notes.
And if you have anything that we discussed today that is interesting to you, you want a little bit more. Feedback on leave a comment below the video and I promise I’ll get back to you as soon as you leave that comment All right. Let’s go. Have a great week. Everybody. Have an awesome. Awesome day Thank you so much for joining me And if you have any questions leave a comment if we did a good job Do me a favor give us a thumbs up and make sure you hit that subscribe button All right.
Have an awesome day everybody. I’ll speak to you soon.


Responses