Chasing Overbought Stocks Is For Broke People 2-5-24
Transcript
Hey everybody, welcome to Stock Trading Pro. Today we have a ton of stuff to cover and there’s a big question in the market right now whether or not the stock market is running too high. That’s really what we’re going to cover right now.
We’re going to kind of build an argument for both sides of the market. And one of the things we want to talk about today is anything less than perfect should instantly mean different trade management. Now we specifically talk about different trade management in relation to perfect.
Everything starts up here where it’s exactly what you could possibly want. The market looks good, the stock market’s on your side. There’s sector rotation that you’re looking for.
Industry groups are clear and you’re near an optimal entry. Everything looks perfect, right? Optimal entry. Implying that at that moment you’re about to buy.
There’s still most of that profit potential available. We’ll give you an example of some stocks here today. We’re not actually there right now.
One of the biggest arguments for and against where we are, clearly we’re not looking to pick a top. I want to be super clear about that. The stock market is going, it’s continuing to churn.
What we’re talking about right now is what is the appropriate risk for the next likely reward. That’s what we’re talking about. We actually had quite a few coaching calls recently discussing and game plan meetings, which you do every morning at 830, determining if a stock is a valid, bullish trade.
And then taking the second step, which is, is it an optimal entry right now from a risk reward perspective? And again, we’re very big on posted pads in this channel and we like to really make sure you take some good notes down. There’s a big difference between it’s obviously going up versus right now is a good time to buy that stock, and that’s something you want to write down. Most of the people that come into the community that kind of have experience and whatnot, they usually don’t have a problem with understanding how to read the charts.
What they do have a problem with, or a lack of understanding is actually how to be a trader. And that’s very different from understanding how to read chart patterns. How to read chart patterns is kind of setting up the idea, but then actually getting deeper into risk reward probability, optimal entry, and then how that translates into position size.
That’s a whole second part of the idea, which is really what separates I can read charts from I understand how to be a trader. And then when you take that even one step deeper, then you kind of add the sectors into the argument of the stock that you’re looking for. For or against, is your idea in the stock supported by large majority of ideas.
And I’ll actually show you what that looks like right here.

So if we kind of work our way into what we would call bullish stacked order flow, what we’re really looking for is the amount of stocks in the same sector doing the same thing. So you kind of get a feel look at industrials here right now, just like that.
So let’s say you’re looking at caterpillar on this breakout. What we’d be looking to do is make a distinction of how many stocks in that same sector are doing the same thing. Now, the language that you want to try to teach yourself, the trading language, the trading lingo, so you sound super smart at a barbecue when they end up happening, is we’re talking about order flow.

So order flow are the institutional orders that come into the market, that create the demand, that moves stocks up and down. That’s kind of stage one understanding it.Stage two is paying attention to how long that order flow has been happening.
And I want to actually give you a pretty good example here in a stock called VRT. It’s giving us a really good visual where you can clearly see it’s pushing and pausing and pushing and pausing, and pushing and pausing and pushing and pausing. Little bit of a profit taking at the end of the year, beginning of the year, which pretty much most stocks did.

But then it came right back into a push and a pause, a push and a pause, another push, and now we’re kind of waiting for the next pause, for the next idea. So as you’re building out your ideas, stage two is how long has that stock been under accumulation? How long has that stock shown consistent pushes? And then they take a break,and then the buying pressure picks up again. Right.
That’s stage two. Stage three is where you start to notice those things across a sector. So not only one stock doing that, but multiple stocks over time doing the same thing.
So I’d love to see you take a screenshot of this right now, because when you start to break it down a little bit deeper, you can see that you want to be tracking this from the last week, last five days, the last 21 days, where we are from, the days open, which is very important because that’s establishing that from where it opened, there was follow up order flow right through the end of the day. And then obviously, the last one, which is ironically the only one that a lot of people use, which is net change from the previous open. So hopefully you can see that great trading ideas.
Really having conviction in buying a stock is so much more than whether or not it just came up in a scanner yesterday. When you start to put these pieces together, this is where your confidence and your conviction increases. Not because you now have the ability to predict what’s going to happen next, but because you’ve just built a bunch of reasons to believe what is happening will continue.
And that’s a really big distinction and quite frankly, a pretty big difference in the way that we look at things compared to a lot of people who feel like, where is this going tobe a month from now? That is such backwards thinking. And quite frankly, that’s why most people are frustrated in the market, because they’re trying to predict where it’s going to be, as opposed to simply saying what is happening. What are the odds of this continuing? If it does continue, what do I do? Which in our language is adding shares and using a profit maximizer.
And if it does not follow through, how do I know when it changes? And then what are the right actions for that? So the biggest thing I want to get across to you right now is that great trading, confident trading, consistently profitable trading, is more about reading the market and having a plan than it is about forecasting where it’s going to bea month from now, two months from now. And I’m going to give you a little bit of a test right now to let you know which of those camps you’re in. Are you in the prediction camp or are you in the reading camp where you’re just reading the price action.
Raise your hand if you’ve ever hesitated to put a trade on because you were afraid that trade wasn’t going to work out. Well. That means you’re predicting if you have an edge, just simply place the trade and read what happens, as opposed to being afraid to place the trade, hoping that it moves in your favor, as opposed to no matter what happens.
I did a great job building this argument. If it follows through, cool. I know exactly where I’m going to add.
I know exactly how I’m going to manage my profits. Or if it doesn’t follow through, I also have a plan for that that puts me in control. That puts you in control? That puts John Bates in control.
Good morning, John. Always a pleasure to see you, man. Miss you.
So big thing. As the market continues to grind higher, we’re not going to be looking to call a top. We’re not going to say we’re afraid.
But what we are going to do is build the argument for whether or not we expect it to continue, and that is going to affect our trade management. So, again, one of the things I’m really big on in trading is anytime we’re looking to buy a stock, we want to compare it to what it’s like to be driving on a highway. And I grew up on Long island in New York, so everybody knows the 495 Long Island Expressway.
And trading is very similar to driving. You get on the highway and then you’re making assessments, and then as you make those assessments, that’s going to tell you whether to step on the gas or step on the brake. Trading is exactly the same way, and a lot of people in the stock market fail to make the second set of decisions.
They’re like, I’m getting on the highway and I’m just going to drive. That’s not how it works. You don’t just hold the wheel steady and you say, oh, my God, I’m just going to do straight and I’m going to do 80.
It doesn’t work that way. Trading is the same way. Once you get on the highway, once you put on that trade, there’s a whole other set of distinctions we need to notice.
What are the cars in front of us doing? Is it wide open? Is there a police officer on the side? We got to take our foot off the gas and just cruise a little bit. That’s what will separate you from everybody else who’s having a hard time in the market, because they’re trying to make that one decision and completely ignore that second set of decisions. It’s not set it and forget it.
There’s decisions to make, new distinctions that lead to new, better decisions. So obviously, what I’d like to walk you through today is some of those distinctions and exactly how we’re coming out with those. Okay, so this is the research that I pop out every day for our community, and I want to walk you through the core part of setting up trades.
So, obviously, we’ve spent quite a bit of time recently talking about what is the market doing and what would be perfect. What would we want to see. Well, perfect would be these big green energy candles.
We call them energy because there’s big separation between where it opened and where it closed. Right. So we had the Fed announcement last week, and the market kind of just really crashed after that, the next day.

So going into that day, we’re like, okay, heavy volume, big red candle equals not good. But we can’t ignore the bullish action that we’ve had since last November, which is basically now three plus months of buying pressure. So one thing to remember is one day is not going to change an entire bullish or bearish order flow, but it’s something to pay attention to.
So heading into Thursday and Friday last week, we were very clear, will the bulls step up and defend the last three months of buying? And then we kind of outlined it. Now, this is the really big part that I just really want to get across. Okay.
I want to make this clear. It’s more important to know what is probably going to happen and what you definitely plan to do. That’s what real trading is about.
And honestly, if you’re stressed out of your mind in the market and overwhelmed and all those kinds of things, when you think in those terms of what do I want to see andis it there, that’s it. But first you need to have a strategy to know what you’re looking for. Right.
So if we kind of put that into the equation and we’re looking at the way that the market kind of unfolded on Thursday and Friday, pretty much exactly what we would have wanted, right. Big green energy candlesticks, heavier volume closing near the highs, pushing into new all time highs. And on the surface, that’s pretty okay, right? That looks pretty good.
But then you kind of add more to that, especially when it happened after what the Fed did. Right. Now, everything we’re about to talk about is kind of bringing the macropicture in there.
Monetary policy, what does this mean for interest rates? But we’re going to keep it high level so it’s actionable. Right? Perfect price action after the Fed, but this is really where the new metrics come in that are in addition to what we’re watching in just the price action. So remember, I want to be super clear about this and I want to help you really get to the point where you feel like, I know exactly what I’m looking for and I know exactly what kind of decision I need to make from that.
The more pieces you can put into the reason you want to buy that stock or even, maybe even thinking about getting out of it for a profit, the better because you have piece after piece after piece adding to that conviction. So we just talked about great price action on Thursday and Friday. So then we went to our secondary indicators and we said, what do they look like? Are the majority of stocks rallying at the same time that the market, the S and P 500 specifically, just hit those new all time highs? And the answer was no.
That’s where we’re kind of like going a little bit cuckoo for that. Right? So now the market breadth continues to remain less than great. So for those of you that don’t necessarily know what market breadth means, we have a visual here of the S and P 500 and all of the stocks in the S and P 500 over the last week.

Now, the stock market specifically making new all time highs, Nasdaq up there as well. Dow actually kind of catching a bid with industrial stocks getting strong. We’re going to point that out in a second.
What this means is that we don’t have kind of like that giant spider web of strength. We kind of just have these large cap stocks which are so heavily weighted in the index, it’s making it appear much stronger than it actually is. Now we’re going to get to the economy in just a second and how we kind of add that into the equation as well.
Now you can see Amazon obviously had a monster move. Nvidia continues to punch higher. SMCI continues to punch higher.
Apple did not have good news. Google did not have good news. Tesla still kind of grinding lower.
And let’s actually talk about Tesla stock because that’s been a big topic of conversation and people asking questions right now. Tesla is kind of hovering right around this 180 level and holding that bearish gap down after earnings. If Tesla cannot hold 180, I’m just going to say it straight up right now.
We’re on video. I believe that 160 is kind of a no brainer. If that thing cracks through 180, it’s been able to hold 180.

And you can see it’s kind of been chopping around at this level. But what has changed? That’s the thing. We’ve had now four consecutive earnings reports out of Tesla declining margins.
That is a big deal. A really big deal. Let’s strip Elon Musk out of the equation.
I know you can’t do that, but let’s strip Elon Musk and his celebrity status out of that and how much everybody loves him. At some point, we have to start talking about Tesla, the car company, and what it looks like from the actual numbers. And as of this moment, with all the information that we have, nothing has changed from one report to the next.
It does look like this 180 is going to be a really big place of price discovery. If bears overtake them at this point and a lot of institutional orders start to come in at that level, I do believe 160 would be the next level. I’d start to look to nibble, provided that we see some heavier volume down in that area.
Now, one thing we do get is we get a lot of questions of what does that look like, what does accumulation look like where it looks like somebody’s stepping up and doing something. And we actually have this stock that’s actually bearish right now, which is called Albemarle. Now, just on the surface, if you’re not looking at anything other than the price action, that looks like a stock that is just absolutely ready to get demolished.
Right. And very well could. But we want to be the best stock trader we can and we want to make sure we pay attention to what’s going on on the institutional side of things by tracking order flow.
Look at the size of the volume increase here over that last couple of months. Now, there’s two things you could say. The last earnings report was not amazing and thestock did not rally with the rest of the market, and you’d absolutely be correct.
And we have another earnings report coming out here. It looks like midweek, Wednesday the 14th. So we got about another nine days for that.
But the bigger picture here is that there is a massive volume spike happening over a few months now. So you have relative strength. Last earnings report wasn’t good, but the stock is in a trading range with massive volume.
So this is kind of the price action that we’d be looking for to possibly nibble on. Tesla is if it does break that 180, punches down to 160, and then has a sideways price action on bigger, heavier volume, that would imply institutions are stepping up and supporting that price. So what’s really interesting about this particular one, this kind of price action, is where short covering rallies can typically be violent.
So in other words, if you know about the GME spike that happened a few years ago, GameStop. And then obviously casino stocks. Oh, gosh, what’s the other one? I’m having a brain fart on that one.
The cinema stock, it can’t completely. AMC. Oh, my God.
Those were short covering rallies based on the amount of short float. Right. So obviously there was a lot of shorts betting on it going down.
But what ended up happening was it stopped going down, shorts had to cover, and then new buyers came in. And that’s what creates that fast move to the upside. Right.
Well, we get a question all the time, is how can I spot a potential short covering rally before it happens so that we could at least position ourselves? Well, what we just showed you in ALB Albemarle is a massive accumulation happening right at a breakdown level as earnings are about to come out. So we’re just going to kind of map out a trade that might not necessarily unfold, but if it does, now, this is a big, big thing with trading. If it does, we go get them.

And if it doesn’t, we leave it alone. That’s the part of trading that a lot of people mistake with the stock market where they think I planned for that. Therefore, I have to place the trade no matter what.
No, we have to say, what am I looking for? What’s probably going to happen, and what do I do if it does? And I’ll do nothing if it doesn’t. So in this particular instance herewith ALB and this super obvious support and earnings coming out, what we need to pay attention to, very similar to what happened here and here. So this is a really beautiful example of this where we pushed down, barely took out that support and did not follow through.
That’s the short covering rally that we’re talking about now. You can see we’re consolidating, consolidating, consolidating on that big, heavy volume. If this thing punches down and we get a candle like that, there’s a pretty good chance we’re going to get something like this.
So do you see how this is not complicated? It’s a matter of, this might not even unfold for another few days, but we’re ready for it. If the stock breaks down, if the next day it reverses on heavy volume, we would expect those short sellers who bet on it going down, they need to get out. New buyers step in, and then we get these kind of two or three week rallies right off of that.
Now, I want to give you an example. In a stock that happened a few months, maybe four months ago after earnings came out, was not good. Big giant red candle.
And you would say, oh, my gosh, that thing’s definitely going down. Bad news, big red candle, heavy volume broke support and then the next day went up. So one day later, the buyers stepped up and the sellers kind of left town, and we had a three month rally that was just crazy.
Can you guess the stock? Well, let me show you. It’s right here. And we’re going to add volume in and we’re talking about right here.
So if we kind of work in volume here and we kind of zoom out, look at that heavy volume breakdown and what you would expect to have happen next. So if we kind of zoom in a little bit more on that, what should happen next? We should see another one of these. We should see, well offered, lower lows, lower highs.

Big red candle closing near the lows. We didn’t we got an inside candle, another inside candle, basically invalidating that big move to the downside. And look what we end up getting after that.
This is a whole other story over here right now with the bad news on the company. But that’s not the point. The point is we want to make sure that we’re prepared for anything and then take action if what we’re expecting unfolds.
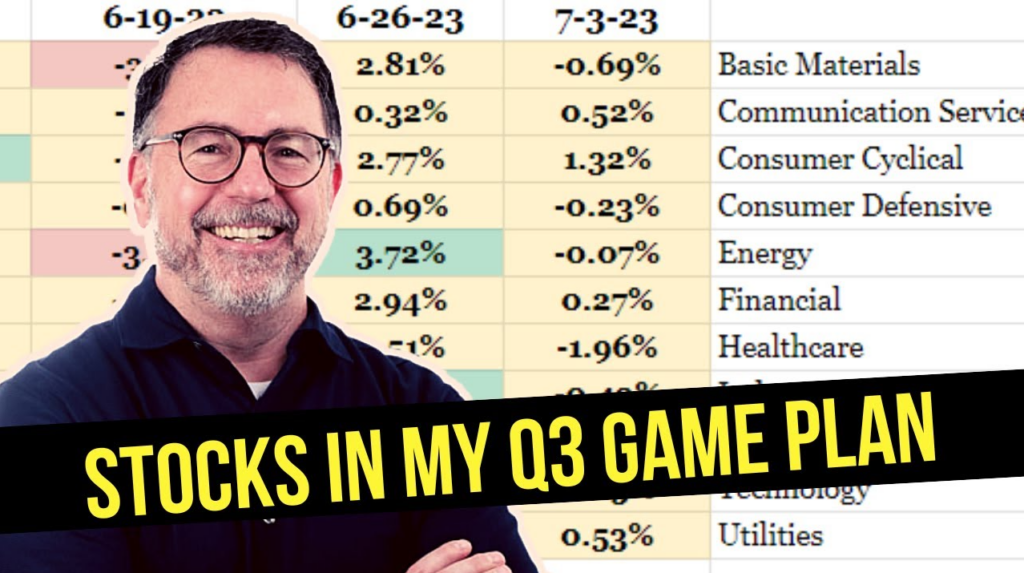
So how do we kind of tie that back into what’s going on in the big picture of the market right now? Well, we got to start with sector rotation and how we looked last week.Really not a lot going on last week. Consumer cyclical actually had a really nice move.
There’s some stocks in that industry. Obviously, communication services had a big move, but again, no market breadth. That was mostly coming off of meta.
So this is what we have coming into the week, not really a massive lining up across the board. Right. So that’s the first part of heading into this week and which stocks we plan to buy.
But more importantly, before we decide which stocks we want to buy, we have to put a qualifier on the market. My friend John Napolitano calls it grading the market. Again, I want to give you a very simple explanation of this.
You have to know what perfect looks like within your trading strategy. Once you know what perfect looks like, that means now you understand what kind of initial position size is the correct play for that moment. Now, a lot of the ideas that we’re looking at right now, and we just showed you how strong the industrial space was.
Besides Boeing, Caterpillar, General Electric, a lot of these guys are strong and pushing, but they’re a little bit beyond the optimal entry.

So now we got to go down the list a little bit and find some stocks that are still at the optimal entry but in the right sector. So if we kind of work over here, you can see how many stocks and across how much time have bullish stacked order flow.
So if all of this was a little bit new to you, you probably want to go back and watch the video one more time, because we walked from the early stages of bullish order flow,worked our way into how long has that been happening? And then we kind of took it a step further in how is that affected across a sector? So the more of those pieces where you have proof, again, proof in the form of price action and volume, that means institutions have attention on those stocks, and then it warrants us having attention on those stocks. So I’ve been very clear for the last ten weeks, I have been bullish but I have not traded increased position size because the market has not really pulled back at all. We haven’t really had that other than the first week of January where everybody’s saying that was tax selling.
Right. All those profits from last year. Tax selling, first week of selling and then buyers stepped right back in.
Right. So now we have another part of the equation, setting up this earnings season, setting up the next three to six months in the market, which is the Fed. We’re going to get into stock specific stuff in a minute, but we have the jobs numbers from last week.
And I just want to really point this out for everybody how significant this was. So last week the US economy added 350,000 jobs. Right? Now.
This is such an understatement. It’s crazy. It was double the amount that was expected.
Double. So what does that mean? Well, we know that the Fed has three mandates, right? Employment, keeping prices stable, and interest rates. That’s like literally the mandate from Congress.
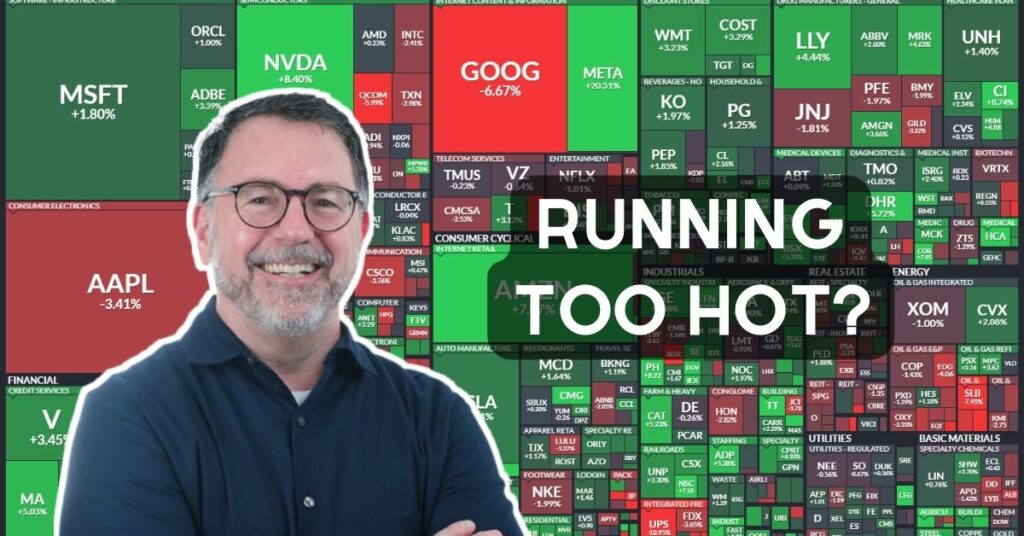
And they will adjust interest rates up or down based on prices, which is measured through inflation, generally through PCE or the CPI, if you really want to kind of dig in there a little bit deeper. But one of the things that they have to watch is, is the market running too hot? And what does that mean they need to do to make sure that it kinda stays stable so prices stay stable so that we can afford to go out and do something. Right.
So this number being double is very significant. So now the Fed, despite last week’s announcement, they have to now consider, is the market running too hot? Well,maybe the market’s forecasting a little bit. If you go back to what we were talking about before, and we kind of dive a little bit more into the metrics and we work our way over here.
Let me just make this a little bigger for you, where even though the market’s making new all time highs three out of the last four days, the advanced decline difference is negative. Now, these are the kinds of things that we need to pay attention to. And notice it doesn’t necessarily mean getting out of a trade, but when you start to see signs that are not perfect.

Now, what would you be thinking if we had a conversation, let’s say Joe and I are at a barbecue and we’re talking about, and we’re like, we’re watching the market make new highs and that kind of stuff. We’re like, man, everything looks great, including the advanced decline line. We’re seeing that go up and continue to stay positive, close to perfect.
Right. And then we don’t touch it, we don’t leave it. We just leave it alone and it goes.
Right. But what if that’s not happening? This is really the part that I want to get across. What if that’s not happening? What if what you want to see is not unfolding? Now I want to be super clear.
I am not talking about being bearish. I am not talking about picking a top. Only idiots do that.
I did that early in my career. Dumbest thing I ever could have possibly did. Now I just stay in the same direction as the market.
What we’re talking about now is what do we do with open existing profits if we are starting to see a super hot jobs number, which by the way means the economy is doing amazing. But that’s not, we’re talking about, we’re talking about how would that affect the Fed? And what everybody is looking for in the stock market right now is those golden words. We’re dropping interest rates.
A couple of months ago everybody thought they were going to do it. Now they didn’t. Now that number for the next announcement in March, that number is dropping as well.
That jobs number was not good for the Fed to be reducing interest rates at the next meeting. So the whole point of all of this is part of the month cuts. Exactly.
Thank you RSI. The big part of the reason the market has started rallying in November, all came off of higher for longer from the Fed no longer being believed. Despite theFed saying that that’s what we’re still doing.
So that was expectations of sooner rate cuts that did not unfold. We are still grinding higher. So again, this is a big difference between, I’m going to point out something that was a really big part of what happened when the market was going down through the summertime.
And I just want to put that in the video so everybody understands what we’re talking about. And this is a really important part, which is this move to the downside. Right.
During this time over here, all you heard from everybody was about the inverted yield curve. This is rallying. And as soon as this thing continues to rally, the difference between the interest rates create that inverted yield curve and historically shows that inverted yield curve turns into a recession for the economy.

Right. Historical fact. Right.
But it didn’t roll over yet. Michael Burry didn’t make money on the, all the probably talking heads, you might say. And again, full respect for Michael Burry.
That’s not the point. The point I want to make, which we’re talking about the jobs numbers, we’re talking about the advanced decline line no matter how many of those pieces you put into the puzzle, you’re still trading the price action of your stock. So price still needs to validate all these historical things that are going on.
So if we kind of put this all together, advanced decline line at new all time highs going down, not great, not perfect. Still bullish. Not perfect.
Super hot jobs numbers, not good to expect the Fed to lower interest rates sooner. So if the Fed’s not going to adjust interest rates sooner based on that data, I’m not saying they’re not. I’m saying what I’m implying is going to happen.
This is not a great scenario to get aggressive up here. That’s really the point that I want to get across because we have very structured ways of adding into trades and westart to build positions. And that’s very important to understand how and when it is appropriate to continue to add to a position.
In this particular instance and the way the market’s been kind of trading, I have actually lowered my initial position size. So I just want to give you some numbers because I really like to give everybody visuals. I want you to understand that there are different quality of ideas that warrant more money in the deal.
So if you could just imagine like a real estate deal, we’re like, oh my gosh, this deal is so crazy. I want to scoop it up and you’d be a little bit more inclined to put more money in that deal. Stock trading in the stock market is the same thing.
So all of the things that we’ve been talking about right now are adding into the idea of how awesome that idea is or taking out like, okay, that’s not perfect. That’s not perfect, that’s not perfect. So I want to give you a visual.
We’re still clearly going up, still good, but I’m not increasing my position size yet. Okay, we have Ed shares, but my initial position size is still on the lower end. I need to see a little bit better breadth in the market where I want to see it expanding out to stocks other than meta and Amazon and Nvidia and those guys that have kind of carried the market higher.
We did see some cracks in Google and Apple, which both rolled over, and Tesla which rolled over. So now this is the thing. This is really the big thing that we need to pay attention to.
If those large cap stocks have been carrying the market, which has been pretty much the story since the beginning of 2023, that’s great. Continue to carry that, continue to trade with them. And again, now we’re getting into if then, if this happens, then that means that, right, if the other stocks in other sectors start to catch a bid, catch a bid means they start to join en masse.
And I want to give you a visual of that because it’s really important. Again, looking at the S and P 500, we want to see none of this purple and red and dark red. We want to see green spread out through technology and communication services and consumer defensive and healthcare.
By the way, healthcare is getting stronger right now. We’re going to take a look at that in a second. So the more market breadth you have, the better.
It’s kind of, if you could think about if you own a store, like when my family owned a deli way back a billion lifetimes ago, we had one big giant customer, it was HomeDepot. Right across the street was Home Depot, and we got all their business. It was fantastic.
The problem was, if Home Depot stopped doing business with us, we were going to be in a lot of pain. So what we ended up doing is we tried to get a whole bunch of other business around that area so that if one piece wasn’t there, which if you could think about the magnificent seven stocks, you’re not hurting, as a matter of fact, you could still be in pretty good shape. So right now, we only have the big one, big blob of magnificent seven stocks and even a few of those kind of pulled back.
What would be better for the market to increase conviction is if we started to see a bunch of different sectors, aside from technology, finding buying pressure over a little bit longer period of time. That’s a mouthful. So what are we looking for? We want to see market breadth improve in the S and P 500.
And that means when you look at the heat map like we just looked at, you want to look at over time, generally one day is not enough. You want to go five days, 21 days,three months, and you want to see that trend where it’s all over the place now, as opposed to just either that one pocket of opportunity of technology or just in those large cap stocks carrying the whole market. Here’s the other side of that.
If market breadth does not improve, and those large cap stocks which kind of really carry the market that whole way, if they start to reach a point where valuations are priced right. So in other words, if we’re buying those cash flows and expecting them to go higher, if they’re now at a point where like meta amazing, right, dividend everything, where now at that price, they have to have some really different story to justify going up from there. If these stocks that rocketed higher, are now correctly priced and have kind of used up all that bullish mojo to get to that point.
If those stocks stop rallying and market breadth does not improve, and the Fed doesn’t say we’re cutting rates, matter of fact, if the Fed says we’re leaving them alone because the job market is too hot. And let’s throw this back into the equation.
If the interest rates, if the ten year, and again, you can see this beautiful trend, right? If the ten year somehow gets back above this level, it’s right at four.

Right? Now. If it gets above this 4.2 level, that would be bearish for the market.
So write that down. TNX, Cboe ten year treasury note. Now, if we talked a lot, a bunch of stuff today that might be a little bit more detailed than you possibly used in the past, watch this video one more time.
Take notes, leave notes in the comments, and I’ll get back to you as soon as I possibly can. What we want to do is we want to get away from predicting what’s going to happen next and say, okay, that happened. What does that mean? That happened.
What does that mean? Now I want to give you a breakdown. You can actually screenshot this when you watch the video. I want to show you how I wrote this in the letter this morning out to the members of our community so that we can actually get to the point where we’re kind of building a roadmap for what could possibly happen.
Okay. All right. Let me actually kind of move over here and I want you to be able to take a picture of this.
So again, what about last week’s jobs report? Now this is the stuff that you want to take a screenshot of or maybe take a note on for exactly what the Fed actually whatRSI is talking about here with the Fed, so that we start to get a picture. Now, haven’t even put oil into the equation, right. The whole oil market is a whole other thing with where they are.
So what I want to do is you can actually keep an eye on this. You could take notes on this, right? But this is really the big thing right now. And that’s the whole point that we’re trying to get across.
It’s a delicate balance between what the market is doing and whether or not they want to start cutting rates. Think about what we just said, that jobs number was doubled what was expected. That is a super strong market.

We’re not talking about the economy being in pain. The Economy is doing great right now. We’re not talking about the Fed is going to raise rates that’s not even on the table at this point.
What we’re talking about is whether or not they’re going to leave them alone. And what does that mean? Now, that’s important because a lot of the stocks that rallied last year were betting on the fact that they were going to cut sooner. And right now that’s getting pushed out a little bit further.
So we have stocks that are very highly valued in a hot jobs number that was not conducive for the Fed cutting quicker. So these are the things we have to keep in mind.So obviously want to get now to some ideas, right? So obviously, despite the barrage of bad news for Boeing, which, again, if you haven’t seen what’s going on with Boeing, just more bad news about something’s going on, which seems to be a weekly thing right now.
I was on a Boeing plane about a month and a half ago. It’s not fun to think about while you’re on the plane. This will all work its way out.
But right now, Boeing might actually be giving us a chance with another push down to get it at a pretty good price. But be aware of the news in Boeing that’s going on right now. All right.
So besides Boeing, caterpillar and a lot of the other industrial stocks are looking pretty good. So this is really where kind of my focus is right now heading into the week.Right.
So we’ve got General Electric, we have Caterpillar, and look at how consistent these moves are. We just talked about VRT and the consistent pushes and pauses. We also have Ingersoll Rand.
Right. Moving over into financials. Goldman Sachs looks absolutely fantastic for a breakout here, right at this.

What’s the level here? I completely forgot the number, but we got to zoom it out just a little bit more because this is a monster level. So basically 390 to 400, but you got to be aware of what’s going on in the bigger picture. This is a really big level.
So a seven week consolidation in Goldman Sachs at a monster level. So what I’m game planning for in Goldman Sachs this week is I actually have my alert set for 400. Idon’t want to get messed up or chopped around in this level where sellers keep shoving it down.
So Goldman Sachs 400 is the level that I have mapped out right now. Okay. All right.
Stocks in the sector, meaning the financial sector, worth watching. Interactive brokers, hig, two asset management companies, KKR and APO, and of course, AmericanExpress, which had a textbook breakout last week. And you can actually see the financials continuing to grind higher.
And you can see American Express again. A lot of stocks pulled back that first week, week of the year, and a really good clean breakout in American Express last week as well. So there’s a lot going on in the market.

So I’m going to let you take a screenshot of this. I’m just going to keep going through the ideas that I have on my game plan for this week. Target setting up another trade actually right at a breakout level with roughly a 15% move to the next level up there, dollar tree.
You can actually see pulled back for about three or four weeks, kind of reengaging again, looking for this next target to the upside, no pun intended. But this is an interesting one. Healthcare is starting to get strong again.
We talked about this a couple of weeks ago where the XLV, which was just storming out of the gate, and one of the best ideas that we had for probably a good four to six week period, maybe even a little bit longer than that, that kind of went sideways for again, another three or four weeks. But now we’re kind of on the precipice of breaking out again. So we started to get a little bit deeper into following up on some healthcare stocks this week.

And I think specifically medical device companies are actually in play this week as well. So you can see the list of ideas that I have on my radar for this week.

And MDT happens to be one of the bigger picture ideas here.
Let me kind of zoom that out so you can actually see the next big level in MDT. So that’s on my radar for this week as well. Now, zooming on over and taking a little bit of a different look at the sector bias.
Right. Obviously, we want to keep an eye on some stocks that are trending and kind of jump in a little bit sooner on those ideas. Consumer defensive is kind of perking up a little bit where it’s showing some consistency from one day to the next, one week to the next.
The numbers aren’t gigantic, but we’re seeing a trend, and that’s important. We just talked about healthcare and we just talked about industrials. So one of the biggest things to do, one of the easiest ways to start making confident decisions in the market is to just say where is institutional attention and what is the easiest way for me to track that institutional attention.

It really means nothing more than which stocks are institutions buying, how long have they been buying them, and is it going on across that sector? When you start to think in those terms, it’s very, very easy to stay away from predicting and just pay attention. By far, that was one of the biggest mistakes I made early in my trading career where I was always trying to predict. I was trying to pick a top, trying to pick a bottom.
And after a while you start to realize this is silly, it’s not working and it’s also too hard. It’s just not necessary. So just think about reading the market as opposed to predicting the market and you then become in control of it because now you know what you’re looking for as opposed to saying where do I think it’s going to be a month from now or two months from now, whatever that time frame is.
So we covered a lot of stuff today. We covered sectors, we covered the market, we covered the economy, we covered the Fed, we covered monetary policy. And that big job number was a big one.
But I just want to leave you with probably one of the biggest things that really caught my attention, which is this, the new highs in the market and the advanced decline line actually going down three out of the last four days. Really interesting thing to keep an eye on. Again, I’m not getting short, but I am certainly watching my profitable bullish trades with a much tighter eye and thinking about moving up those trailing stop losses because of that.
All right. Okay. Have an awesome week everybody.
Thank you so much. I really appreciate you joining me. If we did a good job today and gave you some help, then we favorite give us a thumbs up and make sure you hit that subscribe button.
It would really mean the world to me and it lets me know that this is the kind of stuff that you like. All right, have an awesome week everybody. I will speak to you soon.
Thank you again. Bye.

Responses